Crime rate in West Carthage, New York (NY): murders, rapes, robberies, assaults, burglaries, thefts, auto thefts, arson, crime map
Crime rate in West Carthage, NY
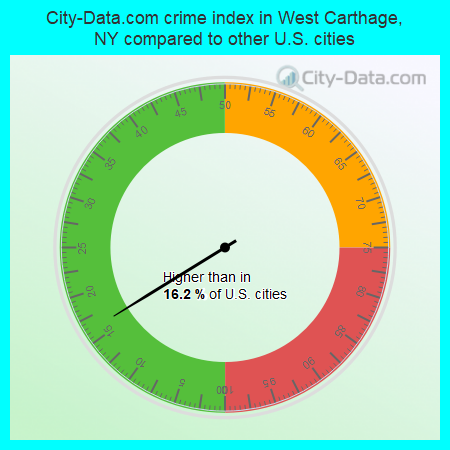
The 2022 crime rate in West Carthage, NY is 24 (City-Data.com crime index), which is 10.4 times smaller than the U.S. average. It was higher than in 16.2% U.S. cities. The 2022 West Carthage crime rate fell by 36% compared to 2020. In the last 5 years West Carthage has seen decline of violent crime and decline of property crime.See how dangerous West Carthage, NY is compared to the nearest cities:
(Note: Higher means more crime)
(Note: Higher means more crime)
| West Carthage: | 23.6 |
| Carthage: | 47.2 |
| Watertown: | 392.8 |
| Lowville: | 51.0 |
| Brownville: | 8.4 |
| Adams: | 8.8 |
| Sackets Harbor: | 2.9 |
| Gouverneur: | 291.1 |
| Alexandria Bay: | 4.1 |
Type |
2009 |
2010 |
2011 |
2016 |
2017 |
2018 |
2019 |
2020 |
2022 |
|---|---|---|---|---|---|---|---|---|---|
| Murders (per 100,000) | 0 (0.0) | 0 (0.0) | 0 (0.0) | 0 (0.0) | 0 (0.0) | 0 (0.0) | 0 (0.0) | 0 (0.0) | 0 (0.0) |
| Rapes (per 100,000) | 3 (137.9) | 0 (0.0) | 0 (0.0) | 0 (0.0) | 1 (50.1) | 1 (50.5) | 0 (0.0) | 0 (0.0) | 0 (0.0) |
| Robberies (per 100,000) | 0 (0.0) | 0 (0.0) | 0 (0.0) | 0 (0.0) | 0 (0.0) | 0 (0.0) | 0 (0.0) | 0 (0.0) | 0 (0.0) |
| Assaults (per 100,000) | 2 (92.0) | 2 (99.4) | 1 (49.5) | 0 (0.0) | 0 (0.0) | 0 (0.0) | 0 (0.0) | 1 (51.9) | 0 (0.0) |
| Burglaries (per 100,000) | 1 (46.0) | 3 (149.1) | 0 (0.0) | 2 (96.4) | 2 (100.2) | 1 (50.5) | 1 (51.1) | 1 (51.9) | 2 (112.2) |
| Thefts (per 100,000) | 6 (275.9) | 15 (745.5) | 0 (0.0) | 5 (241.0) | 17 (851.3) | 12 (605.8) | 9 (459.9) | 9 (467.5) | 7 (392.8) |
| Auto thefts (per 100,000) | 0 (0.0) | 0 (0.0) | 0 (0.0) | 1 (48.2) | 1 (50.1) | 1 (50.5) | 0 (0.0) | 1 (51.9) | 0 (0.0) |
| Arson (per 100,000) | 0 (0.0) | 0 (0.0) | 0 (0.0) | 0 (0.0) | 0 (0.0) | 0 (0.0) | 0 (0.0) | 0 (0.0) | 0 (0.0) |
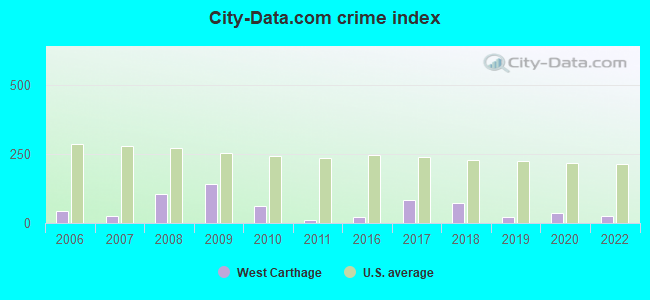
| City-Data.com crime index | 143.0 | 60.1 | 9.9 | 20.2 | 85.1 | 72.2 | 22.0 | 36.9 | 23.6 |
The City-Data.com crime index weighs serious crimes and violent crimes more heavily. Higher means more crime, U.S. average is 246.1. It adjusts for the number of visitors and daily workers commuting into cities.
Violent crime rate in 2022
| West Carthage: | 0.0 |
| U.S. Average: | 219.8 |
Violent crime rate in 2020
| West Carthage: | 26.0 |
| U.S. Average: | 228.2 |
Violent crime rate in 2019
| West Carthage: | 0.0 |
| U.S. Average: | 219.9 |
Violent crime rate in 2018
| West Carthage: | 50.5 |
| U.S. Average: | 221.2 |
Violent crime rate in 2017
| West Carthage: | 50.1 |
| U.S. Average: | 226.2 |
Violent crime rate in 2016
| West Carthage: | 0.0 |
| U.S. Average: | 227.3 |
Violent crime rate in 2011
| West Carthage: | 24.7 |
| U.S. Average: | 187.1 |
Violent crime rate in 2010
| West Carthage: | 49.7 |
| U.S. Average: | 195.7 |
Violent crime rate in 2009
| West Carthage: | 183.9 |
| U.S. Average: | 208.9 |
Violent crime rate in 2008
| West Carthage: | 137.4 |
| U.S. Average: | 222.5 |
Violent crime rate in 2007
| West Carthage: | 19.4 |
| U.S. Average: | 229.1 |
Violent crime rate in 2006
| West Carthage: | 38.1 |
| U.S. Average: | 232.6 |
Property crime rate in 2022
| West Carthage: | 42.1 |
| U.S. Average: | 166.5 |
Property crime rate in 2020
| West Carthage: | 41.6 |
| U.S. Average: | 169.6 |
Property crime rate in 2019
| West Carthage: | 33.2 |
| U.S. Average: | 179.7 |
Property crime rate in 2018
| West Carthage: | 48.0 |
| U.S. Average: | 190.2 |
Property crime rate in 2017
| West Carthage: | 70.1 |
| U.S. Average: | 206.4 |
Property crime rate in 2016
| West Carthage: | 38.6 |
| U.S. Average: | 216.6 |
Property crime rate in 2011
| West Carthage: | 0.0 |
| U.S. Average: | 273.5 |
Property crime rate in 2010
| West Carthage: | 67.1 |
| U.S. Average: | 276.4 |
Property crime rate in 2009
| West Carthage: | 23.0 |
| U.S. Average: | 285.6 |
Property crime rate in 2008
| West Carthage: | 50.4 |
| U.S. Average: | 302.2 |
Property crime rate in 2007
| West Carthage: | 31.1 |
| U.S. Average: | 309.2 |
Property crime rate in 2006
| West Carthage: | 38.1 |
| U.S. Average: | 317.3 |


Zip codes: 13619.