Crime rate in Yonkers, New York (NY): murders, rapes, robberies, assaults, burglaries, thefts, auto thefts, arson, law enforcement employees, police officers, crime map
Crime rate in Yonkers, NY
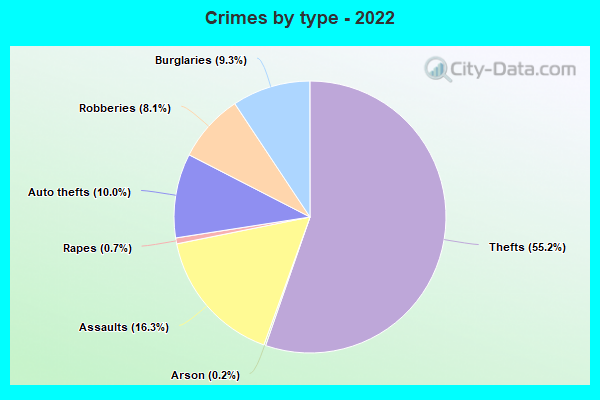
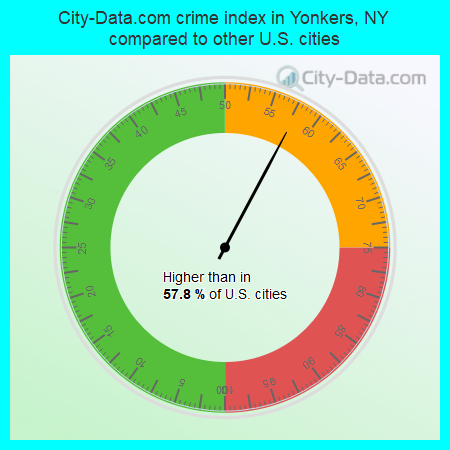
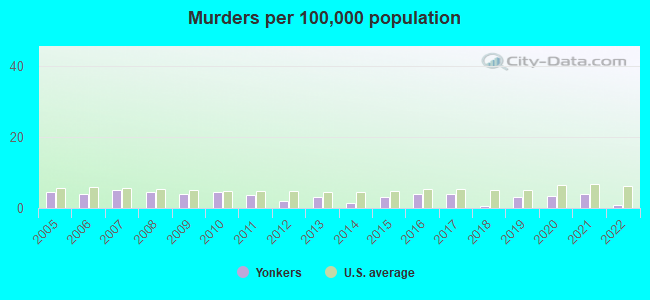
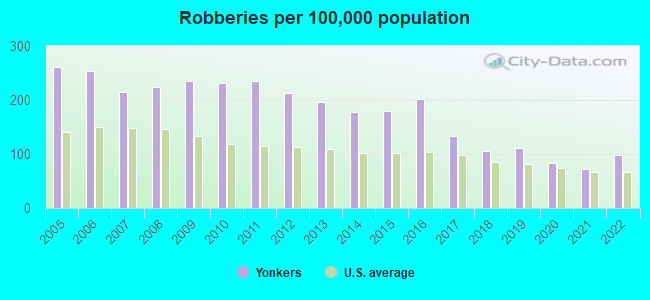
The 2022 crime rate in Yonkers, NY is 124 (City-Data.com crime index), which is 2.0 times smaller than the U.S. average. It was higher than in 57.8% U.S. cities. The 2022 Yonkers crime rate rose by 4% compared to 2021. The number of homicides stood at 2 - a decrease of 6 compared to 2021. In the last 5 years Yonkers has seen decline of violent crime and rise of property crime.See how dangerous Yonkers, NY is compared to the nearest cities:
(Note: Higher means more crime)
(Note: Higher means more crime)
| Yonkers: | 123.9 |
| Bronxville: | 23.2 |
| Tuckahoe: | 6.7 |
| Mount Vernon: | 205.2 |
| Hastings-on-Hudson: | 28.2 |
| Alpine: | 125.1 |
| Pelham: | 45.4 |
| New Rochelle: | 50.5 |
| Pelham Manor: | 155.5 |
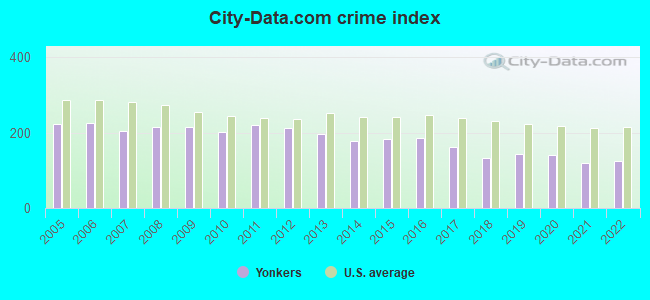
The City-Data.com crime index weighs serious crimes and violent crimes more heavily. Higher means more crime, U.S. average is 246.1. It adjusts for the number of visitors and daily workers commuting into cities.
- means the value is smaller than the state average.- means the value is about the same as the state average.
- means the value is bigger than the state average.
- means the value is much bigger than the state average.
According to our research of New York and other state lists, there were 121 registered sex offenders living in Yonkers, New York as of May 21, 2024.
The ratio of all residents to sex offenders in Yonkers is 1,659 to 1.
The ratio of registered sex offenders to all residents in this city is lower than the state average.
Violent crime rate in 2022
| Yonkers: | 160.7 |
| U.S. Average: | 219.8 |
Violent crime rate in 2021
| Yonkers: | 150.2 |
| U.S. Average: | 224.8 |
Violent crime rate in 2020
| Yonkers: | 177.3 |
| U.S. Average: | 228.2 |
Violent crime rate in 2019
| Yonkers: | 191.9 |
| U.S. Average: | 219.9 |
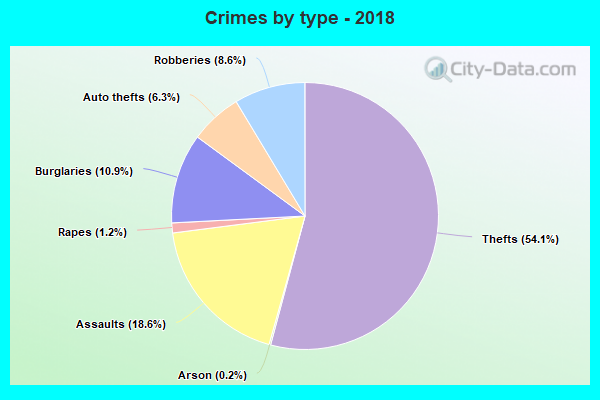
Violent crime rate in 2018
| Yonkers: | 182.4 |
| U.S. Average: | 221.2 |
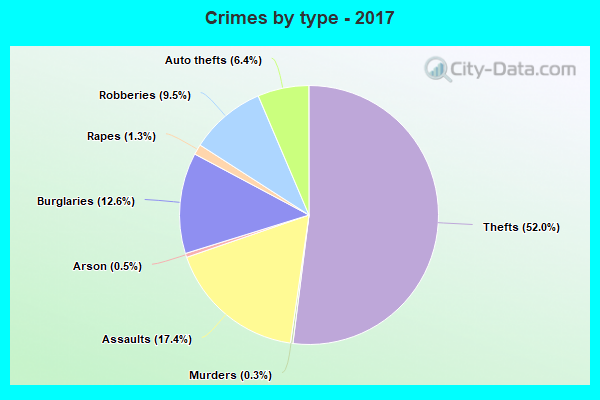
Violent crime rate in 2017
| Yonkers: | 215.8 |
| U.S. Average: | 226.2 |
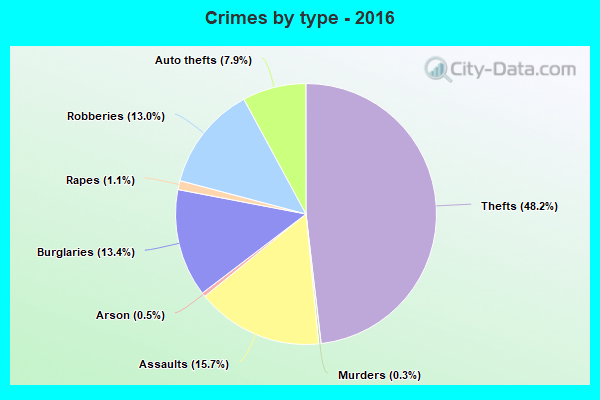
Violent crime rate in 2016
| Yonkers: | 247.7 |
| U.S. Average: | 227.3 |
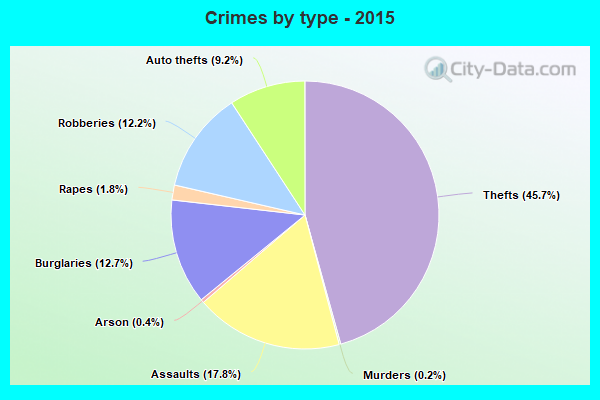
Violent crime rate in 2015
| Yonkers: | 253.3 |
| U.S. Average: | 219.3 |
Violent crime rate in 2014
| Yonkers: | 254.7 |
| U.S. Average: | 211.1 |
Violent crime rate in 2013
| Yonkers: | 270.9 |
| U.S. Average: | 214.2 |
Violent crime rate in 2012
| Yonkers: | 295.5 |
| U.S. Average: | 187.4 |
Violent crime rate in 2011
| Yonkers: | 266.2 |
| U.S. Average: | 187.1 |
Violent crime rate in 2010
| Yonkers: | 242.6 |
| U.S. Average: | 195.7 |
Violent crime rate in 2009
| Yonkers: | 253.5 |
| U.S. Average: | 208.9 |
Violent crime rate in 2008
| Yonkers: | 246.2 |
| U.S. Average: | 222.5 |
Violent crime rate in 2007
| Yonkers: | 234.3 |
| U.S. Average: | 229.1 |
Violent crime rate in 2006
| Yonkers: | 255.6 |
| U.S. Average: | 232.6 |
Violent crime rate in 2005
| Yonkers: | 251.3 |
| U.S. Average: | 227.0 |
Property crime rate in 2022
| Yonkers: | 75.3 |
| U.S. Average: | 166.5 |
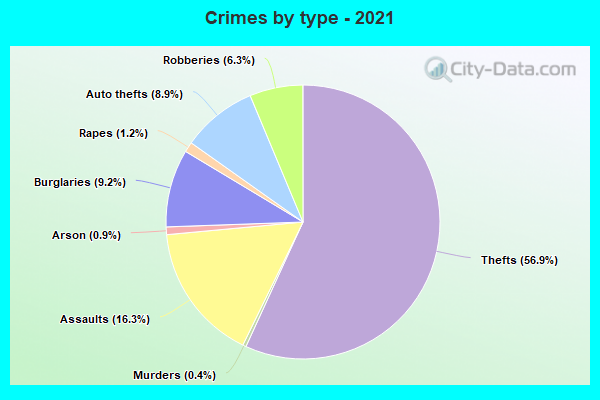
Property crime rate in 2021
| Yonkers: | 68.5 |
| U.S. Average: | 157.8 |
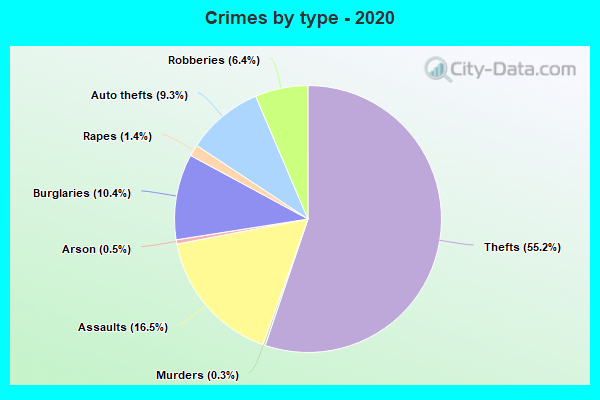
Property crime rate in 2020
| Yonkers: | 82.5 |
| U.S. Average: | 169.6 |
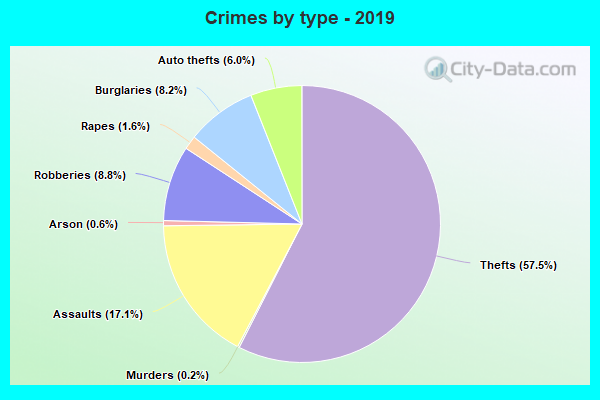
Property crime rate in 2019
| Yonkers: | 68.8 |
| U.S. Average: | 179.7 |
Property crime rate in 2018
| Yonkers: | 71.4 |
| U.S. Average: | 190.2 |
Property crime rate in 2017
| Yonkers: | 86.0 |
| U.S. Average: | 206.4 |
Property crime rate in 2016
| Yonkers: | 97.8 |
| U.S. Average: | 216.6 |
Property crime rate in 2015
| Yonkers: | 91.4 |
| U.S. Average: | 221.5 |
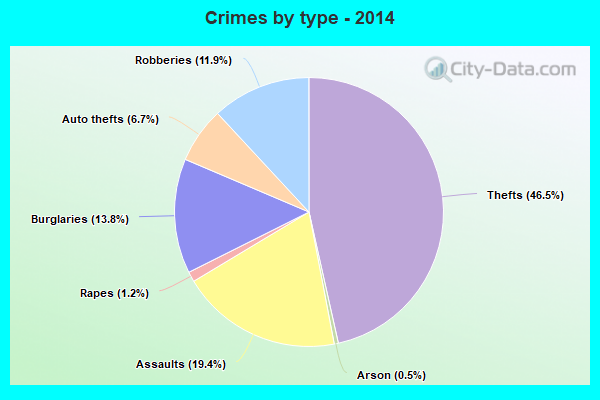
Property crime rate in 2014
| Yonkers: | 91.0 |
| U.S. Average: | 230.8 |
Property crime rate in 2013
| Yonkers: | 106.7 |
| U.S. Average: | 250.4 |
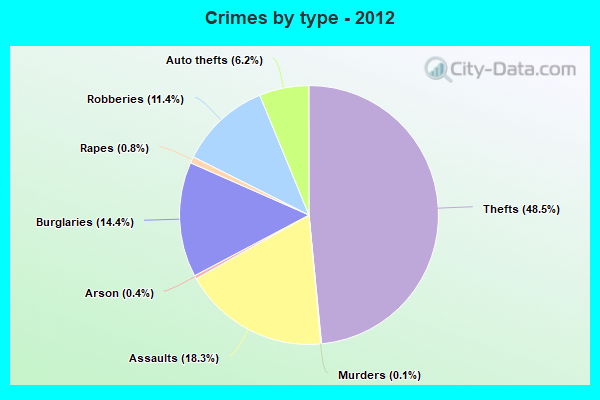
Property crime rate in 2012
| Yonkers: | 116.7 |
| U.S. Average: | 267.3 |
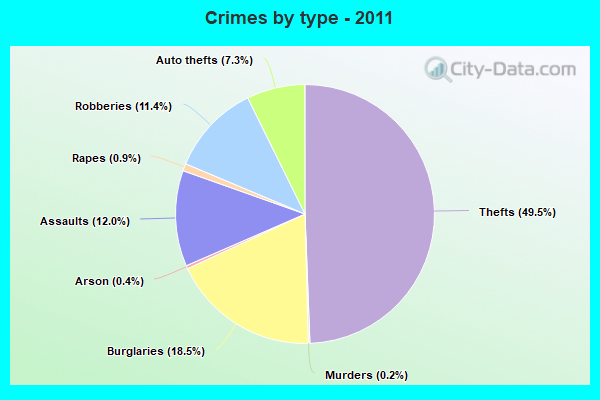
Property crime rate in 2011
| Yonkers: | 150.4 |
| U.S. Average: | 273.5 |
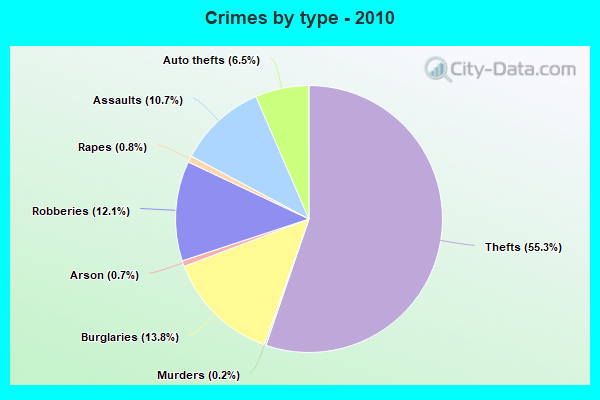
Property crime rate in 2010
| Yonkers: | 125.1 |
| U.S. Average: | 276.4 |
Property crime rate in 2009
| Yonkers: | 140.7 |
| U.S. Average: | 285.6 |
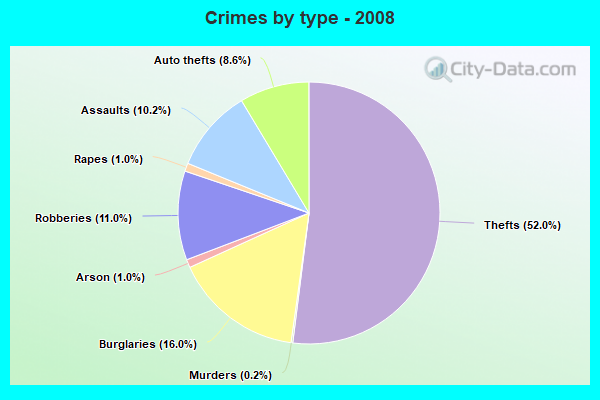
Property crime rate in 2008
| Yonkers: | 145.0 |
| U.S. Average: | 302.2 |
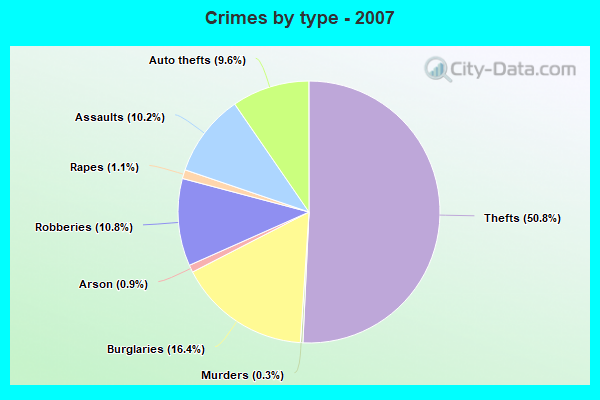
Property crime rate in 2007
| Yonkers: | 140.0 |
| U.S. Average: | 309.2 |
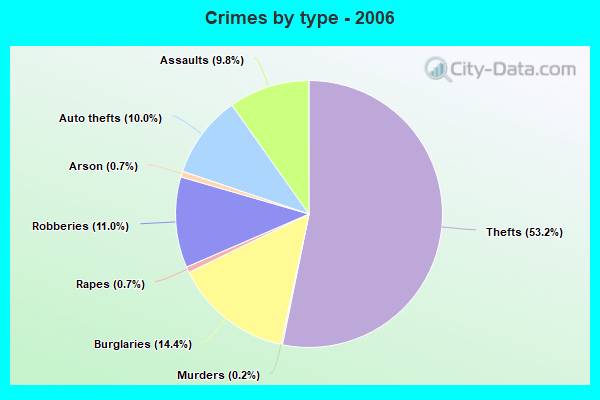
Property crime rate in 2006
| Yonkers: | 157.3 |
| U.S. Average: | 317.3 |
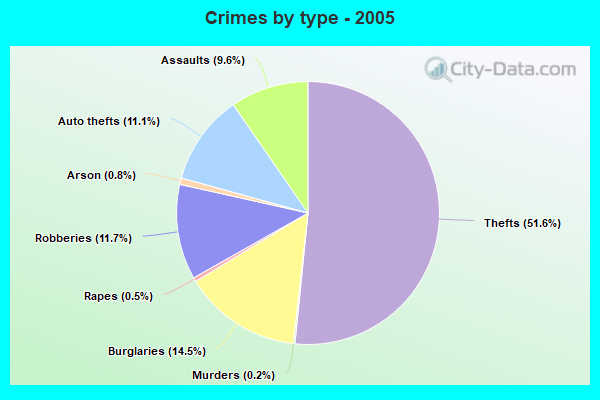
Property crime rate in 2005
| Yonkers: | 155.7 |
| U.S. Average: | 322.3 |
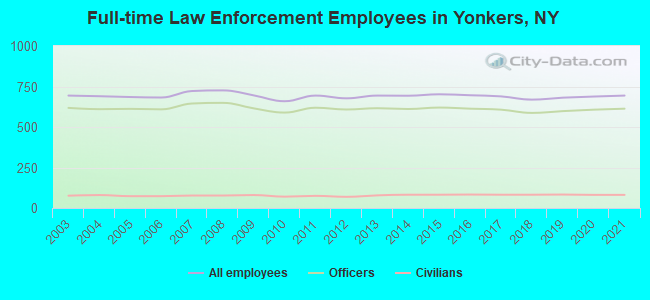
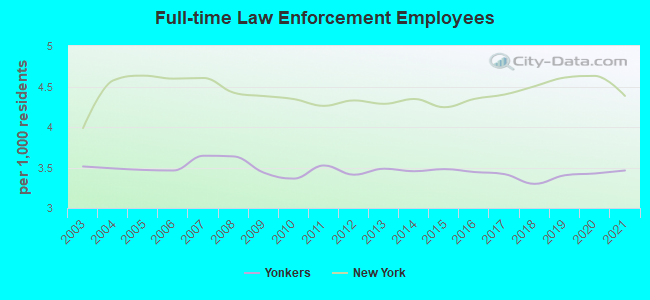
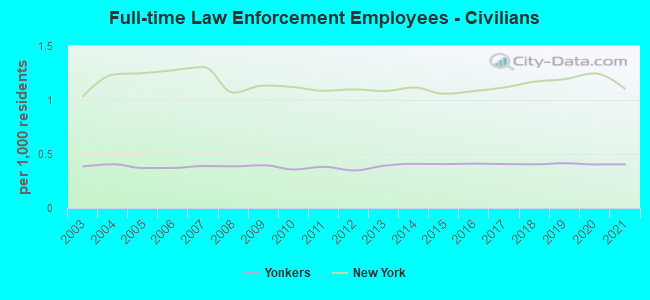
Full-time law enforcement employees in 2021, including police officers: 694 (613 officers - 520 male; 93 female).
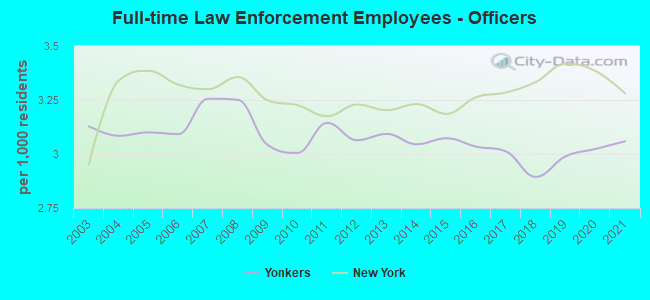
| Officers per 1,000 residents here: | 3.06 |
| New York average: | 3.28 |
Full-time law enforcement employees in 2020, including police officers: 688 (607 officers - 517 male; 90 female).
| Officers per 1,000 residents here: | 3.02 |
| New York average: | 3.38 |
Full-time law enforcement employees in 2019, including police officers: 681 (598 officers - 515 male; 83 female).
| Officers per 1,000 residents here: | 2.99 |
| New York average: | 3.42 |
Full-time law enforcement employees in 2018, including police officers: 669 (587 officers - 512 male; 75 female).
| Officers per 1,000 residents here: | 2.89 |
| New York average: | 3.33 |
Full-time law enforcement employees in 2017, including police officers: 689 (607 officers - 534 male; 73 female).
| Officers per 1,000 residents here: | 3.01 |
| New York average: | 3.28 |
Full-time law enforcement employees in 2016, including police officers: 696 (613 officers - 543 male; 70 female).
| Officers per 1,000 residents here: | 3.03 |
| New York average: | 3.26 |
Full-time law enforcement employees in 2015, including police officers: 702 (620 officers - 549 male; 71 female).
| Officers per 1,000 residents here: | 3.07 |
| New York average: | 3.19 |
Full-time law enforcement employees in 2014, including police officers: 693 (611 officers - 538 male; 73 female).
| Officers per 1,000 residents here: | 3.05 |
| New York average: | 3.23 |
Full-time law enforcement employees in 2013, including police officers: 694 (616 officers - 540 male; 76 female).
| Officers per 1,000 residents here: | 3.09 |
| New York average: | 3.20 |
Full-time law enforcement employees in 2012, including police officers: 677 (608 officers - 532 male; 76 female).
| Officers per 1,000 residents here: | 3.06 |
| New York average: | 3.23 |
Full-time law enforcement employees in 2011, including police officers: 694 (619 officers - 538 male; 81 female).
| Officers per 1,000 residents here: | 3.14 |
| New York average: | 3.18 |
Full-time law enforcement employees in 2010, including police officers: 659 (589 officers - 514 male; 75 female).
| Officers per 1,000 residents here: | 3.01 |
| New York average: | 3.23 |
Full-time law enforcement employees in 2009, including police officers: 695 (615 officers - 539 male; 76 female).
| Officers per 1,000 residents here: | 3.04 |
| New York average: | 3.25 |
Full-time law enforcement employees in 2008, including police officers: 726 (649 officers - 563 male; 86 female).
| Officers per 1,000 residents here: | 3.25 |
| New York average: | 3.36 |
Full-time law enforcement employees in 2007, including police officers: 722 (645 officers - 565 male; 80 female).
| Officers per 1,000 residents here: | 3.26 |
| New York average: | 3.30 |
Full-time law enforcement employees in 2006, including police officers: 682 (609 officers - 545 male; 64 female).
| Officers per 1,000 residents here: | 3.09 |
| New York average: | 3.32 |
Full-time law enforcement employees in 2005, including police officers: 685 (612 officers - 540 male; 72 female).
| Officers per 1,000 residents here: | 3.10 |
| New York average: | 3.39 |
Full-time law enforcement employees in 2004, including police officers: 690 (610 officers - 523 male; 87 female).
| Officers per 1,000 residents here: | 3.08 |
| New York average: | 3.34 |
Full-time law enforcement employees in 2003, including police officers: 694 (618 officers - 545 male; 73 female).
| Officers per 1,000 residents here: | 3.13 |
| New York average: | 2.95 |