Aberdeen: Fire Incidents, South Dakota (SD)
Where are fire incidents reported in Aberdeen, SD
Something went wrong! Please refresh the page.
| Fire incidents reported | |
|---|---|
| Sreet name | Count |
| 6TH AVE | 124 |
| MAIN ST | 86 |
| 8TH AVE | 76 |
| 3RD AVE | 62 |
| 1ST ST | 42 |
| 9TH AVE | 42 |
| 10TH AVE | 40 |
| 2ND ST | 36 |
| 5TH ST | 36 |
| 379TH AVE | 34 |
| JAY ST | 34 |
| LINCOLN ST | 34 |
| ROOSEVELT ST | 34 |
| STATE ST | 34 |
| 133RD ST | 30 |
| 281 HWY | 30 |
| 7TH AVE | 30 |
| MELGAARD RD | 30 |
| WASHINGTON ST | 30 |
| 3RD ST | 28 |
| 4TH AVE | 28 |
| DAKOTA ST | 28 |
| 8TH ST | 26 |
| 11TH AVE | 24 |
| LAWSON ST | 24 |
| 130TH ST | 22 |
| ARCH ST | 22 |
| 129TH ST | 20 |
| 15TH AVE | 20 |
| 24TH AVE | 20 |
| Other | 72 |
2002 - 2018 National Fire Incident Reporting System (NFIRS) incidents
- Incident types reported to NFIRS in Aberdeen, SD
- 2,01728.7%Rescue & EMS
- 1,60122.8%Hazardous Condition
- 1,27618.2%False Alarm
- 1,19817.1%Fire
- 5137.3%Service Call
- 3424.9%Good Intent Call
- 470.7%Overpressure Rupture
- 190.3%Special Incident
- 130.2%Severe Weather
- Fire incident types reported to NFIRS in Aberdeen, SD
- 49341.2%Outside Fires
- 40133.5%Structure Fires
- 21517.9%Mobile Property/Vehicle Fires
- 897.4%Other
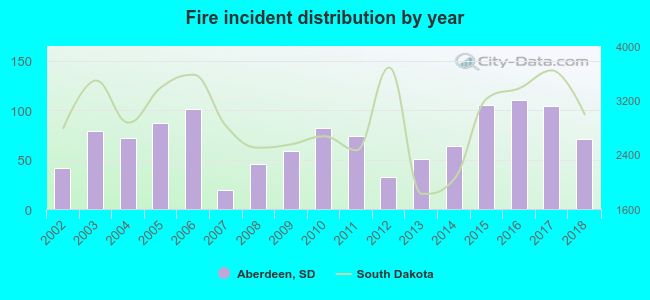 According to the data from the years 2002 - 2018 the average number of fire incidents per year is 70. The highest number of reported fires - 110 took place in 2016, and the least - 19 in 2007. The data has a growing trend.
The average number of yearly fire incidents per 10k residents in Aberdeen, SD compared to nearest cities:
(Note: Based on data for the last 3 years, including only cities with population 5,000 and above)
| Aberdeen: | 34.2 |
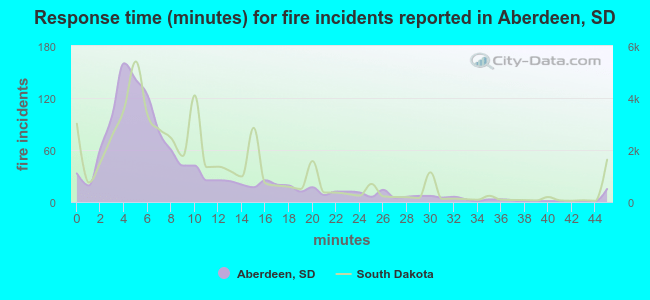 The median response time based on all reported fire incidents is 6 minutes. This is lower than the South Dakota median value.
The median response time in Aberdeen, SD compared to nearest cities:
(Note: Based on data for all years, including only cities with at least 500 fire incidents)
| Aberdeen: | 6 minutes |
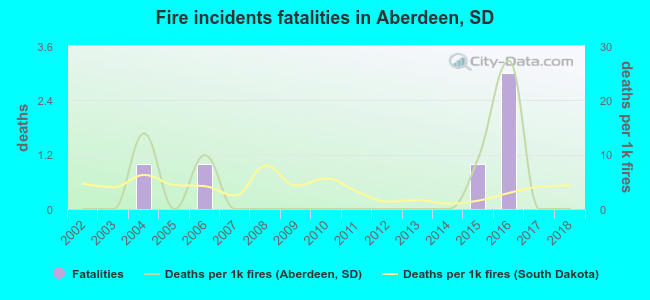 According to the reports from the years 2002 - 2018 the average number of fire-related fatalities per year is 0. The highest number of reported deaths - 3 took place in 2016, and the lowest - 0 in 2002. The data has a constant trend.
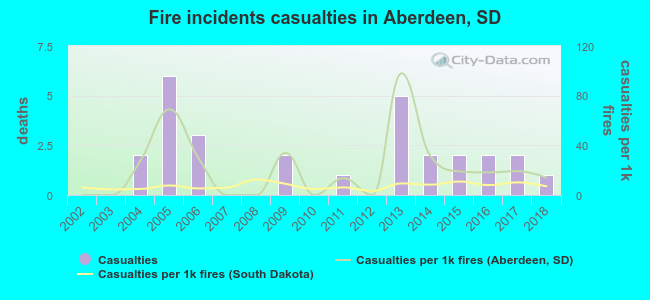 According to the data from the years 2002 - 2018 the average number of fire-related casualties per year is 2. The highest number of reported injuries - 6 took place in 2005, and the lowest - 0 in 2002. The data has an increasing trend.
The average number of casualties per 1,000 fires is 22. This indicator was the highest - 98 in 2013, and the lowest 0 in 2002. The trend for injuries per 1,000 incidents is rising. Compared to the South Dakota value the number of casualties per 1,000 fire incidents is much higher.
According to the data from the years 2002 - 2018 the average number of fire-related casualties per year is 2. The highest number of reported injuries - 6 took place in 2005, and the lowest - 0 in 2002. The data has an increasing trend.
The average number of casualties per 1,000 fires is 22. This indicator was the highest - 98 in 2013, and the lowest 0 in 2002. The trend for injuries per 1,000 incidents is rising. Compared to the South Dakota value the number of casualties per 1,000 fire incidents is much higher.Casualties per 1,000 incidents in Aberdeen, SD compared to nearest cities:
(Note: Based on data for all years, including only cities with at least 500 fire incidents)
| Aberdeen: | 23.4 |
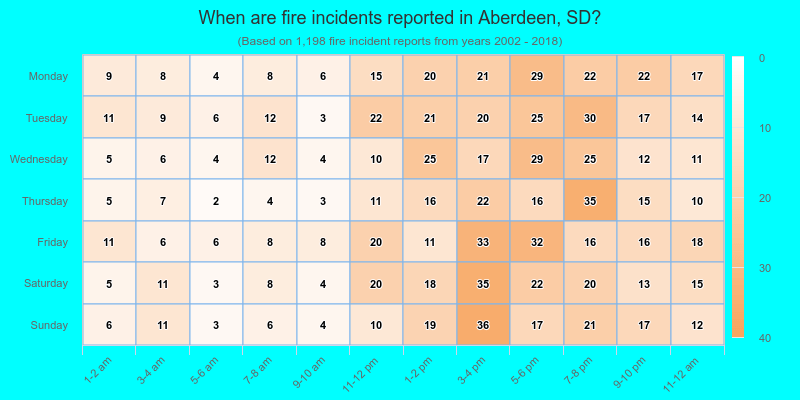
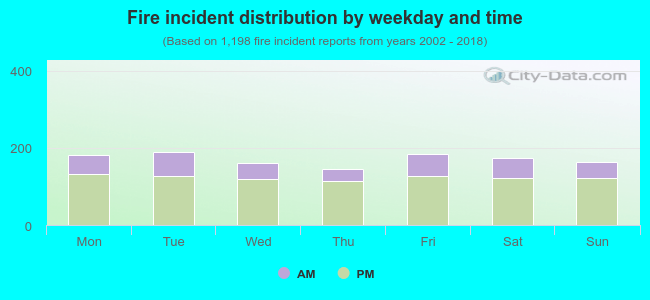 28.0% incidents where reported in the morning and 72.0% in the evening. The most fires (15.9%) took place on Tuesday, and the least (12.2%) on Thursday.
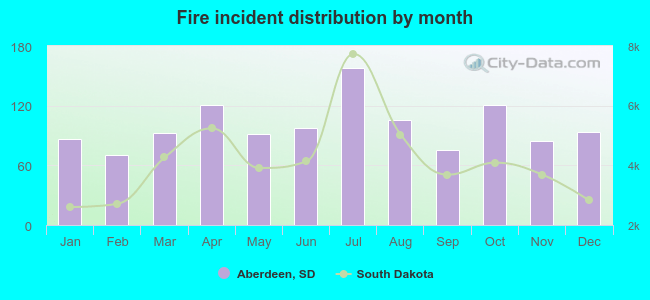 According to the 1,198 incident reports from years 2002 - 2018 most fires (13.2%) took place during July, and the least (5.8%) in February.
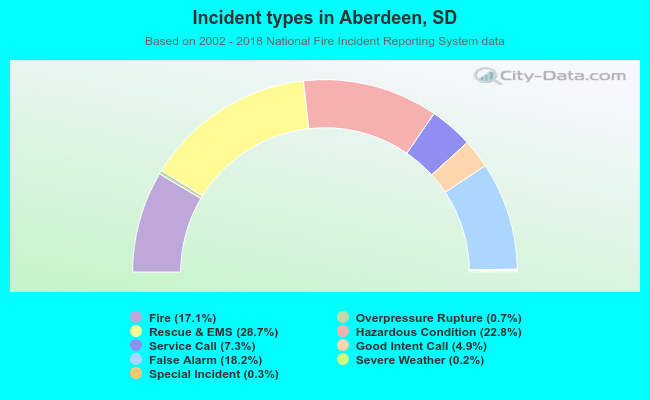 Out of all 7,026 cases reported during the years 2002 - 2018, the most belonged to the categories: Rescue & EMS (28.7%), Hazardous Condition (22.8%), and False Alarm (18.2%).
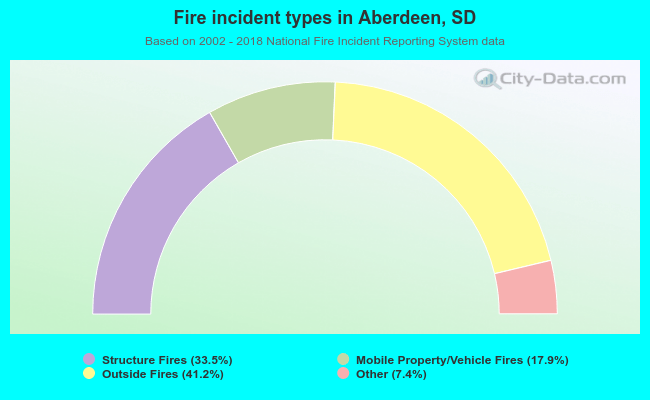 When looking into fire subcategories, the most reports belonged to: Outside Fires (41.2%), and Structure Fires (33.5%).