| Fire incidents reported |
|---|
| Sreet name | Count |
|---|
| HWY 54 NORTH | 10 | | HWY 88 | 10 | | HWY 188 | 8 | | HWY 54 SOUTH | 8 | | BELLS ST | 6 | | HWY 152 | 6 | | PARK ST | 6 | | 152 HWY | 4 | | 2066 HWY 88 | 4 | | 215 HWY 88 | 4 | | 3078 HWY 88 | 4 | | 356 LYONS RD | 4 | | 809 BUFORD ROAD | 4 | | 92 WILLIAMS CIRCLE | 4 | | BURNS | 4 | | BURNS ST | 4 | | CASTELLAW ROAD | 4 | | CONLEY ROAD | 4 | | FORREST STRE | 4 | | HWY 221 | 4 | | HWY 412 | 4 | | HWY 412 CONLEY ROAD | 4 | | HWY 412 EGG HILL RD | 4 | | HWY 412 HWY 188 | 4 | | HWY 412 HWY 88 | 4 |
| | | Fire incidents reported |
|---|
| Sreet name | Count |
|---|
| HWY 54 | 4 | | HWY 54 N | 4 | | HWY 54 S | 4 | | JOHNSONGROVE ROAD | 4 | | NORTH BELLS STREET | 4 | | WEST CHURCH STREET | 4 | | 10 FORREST ST | 2 | | 100 PINE GROVE DRIVE | 2 | | 10137 JOHNSONGROVE RD | 2 | | 1025 FARROW ROAD | 2 | | 1042 WEST CHURCH STREET | 2 | | 110 KOONCE STREET | 2 | | 1160 EAST PARK STREET | 2 | | 1168 ROLLAND ROAD | 2 | | 1171 SOUTH BELLS | 2 | | 1175 SOUTH BELLS ST | 2 | | 12242 JOHNSON GROVE RD | 2 | | 124 AUTUMN VALLEY DRIVE | 2 | | 1346 EGGHILL ROAD | 2 | | 136 EARNEST ONEAL ROAD | 2 | | 1362 IRVIN TUCKER ROAD | 2 | | 1392 WEST CHURCH ST | 2 | | 142 CONLEY RD | 2 | | 142 FINCH ROAD | 2 | | 1461 MCLEIN ROAD | 2 |
|
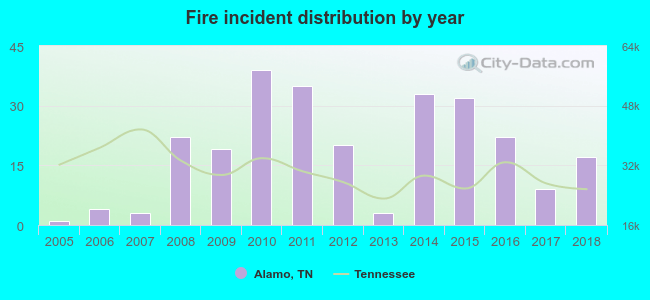 Based on the data from the years 2005 - 2018 the average number of fire incidents per year is 19. The highest number of reported fires - 39 took place in 2010, and the least - 1 in 2005. The data has a rising trend.
 Based on the data from the years 2005 - 2018 the average number of fire-related yearly casualties is 1. The highest number of injuries - 5 took place in 2008, and the lowest - 0 in 2005. The data has a constant trend.
 38.2% incidents where reported in the morning and 61.8% in the evening. The most fires (17.0%) took place on Tuesday, and the least (10.0%) on Sunday.
 According to the 259 incident reports from years 2005 - 2018 most fires (11.2%) took place during January, and the least (5.8%) in July.
 Out of all 342 cases reported during the years 2005 - 2018, the most belonged to the categories: Fire (75.7%), Hazardous Condition (11.7%), and Good Intent Call (5.6%).
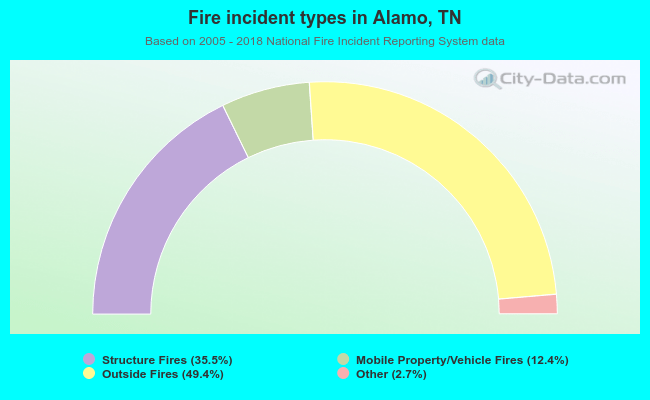 When looking into fire subcategories, the most reports belonged to: Outside Fires (49.4%), and Structure Fires (35.5%).