Alamosa: Fire Incidents, Colorado (CO)
Where are fire incidents reported in Alamosa, CO
Something went wrong! Please refresh the page.
|
| |||||||||||||||||||||||||||||||||||||||||||||||||||||||||||||||||||||||||||||||||||||||||||||||||||||||||||||
2005 - 2018 National Fire Incident Reporting System (NFIRS) incidents
- Incident types reported to NFIRS in Alamosa, CO
- 2,02848.6%Service Call
- 94222.6%Fire
- 46411.1%Hazardous Condition
- 2957.1%Rescue & EMS
- 2526.0%Good Intent Call
- 1874.5%False Alarm
- Fire incident types reported to NFIRS in Alamosa, CO
- 52655.8%Outside Fires
- 29431.2%Structure Fires
- 9510.1%Mobile Property/Vehicle Fires
- 272.9%Other
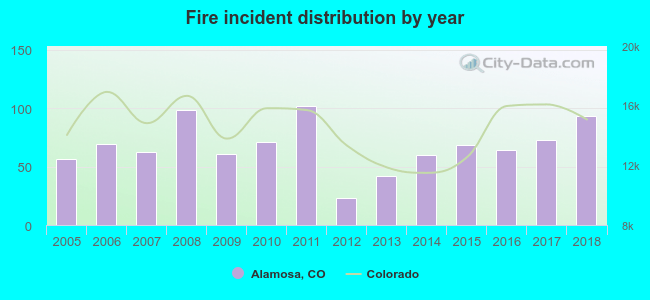 Based on the data from the years 2005 - 2018 the average number of fires per year is 67. The highest number of fire incidents - 102 took place in 2011, and the least - 23 in 2012. The data has an increasing trend.
The average number of yearly fire incidents per 10k residents in Alamosa, CO compared to nearest cities:
(Note: Based on data for the last 3 years, including only cities with population 5,000 and above)
| Alamosa: | 80.4 |
| Salida: | 93.1 |
| Canon City: | 49.6 |
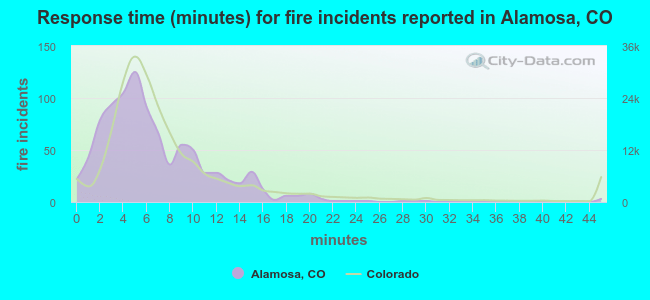 The median response time based on all reported fire incidents is 6 minutes. This is comparable to the state median value.
The median response time in Alamosa, CO compared to nearest cities:
(Note: Based on data for all years, including only cities with at least 500 fire incidents)
| Alamosa: | 6 minutes |
| Pagosa Springs: | 11 minutes |
| Salida: | 5 minutes |
| Canon City: | 6 minutes |
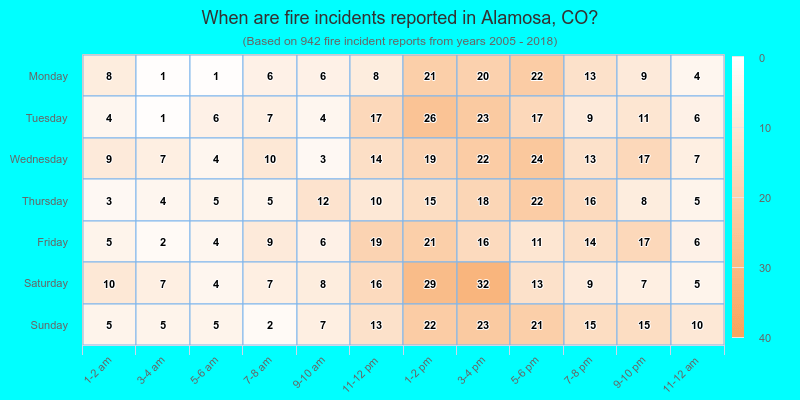
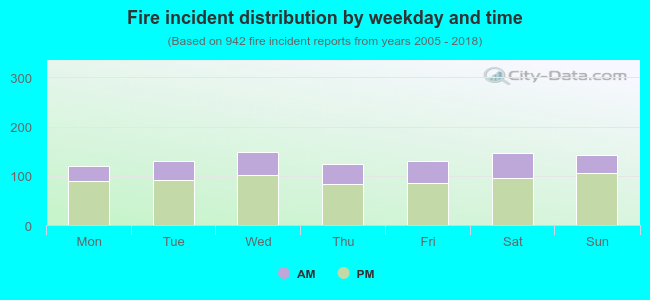 30.7% incidents where reported in the morning and 69.3% in the evening. The most fires (15.8%) took place on Wednesday, and the least (12.6%) on Monday.
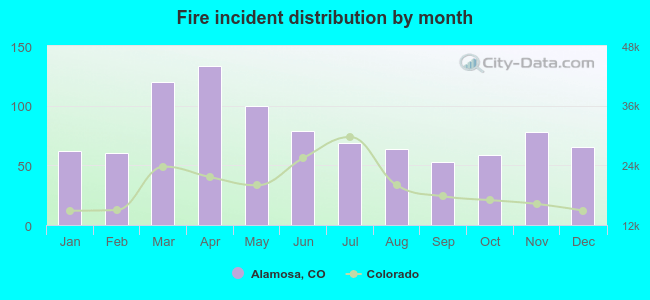 According to the 942 fire incident reports from years 2005 - 2018 most fires (14.1%) took place during April, and the least (5.6%) in September.
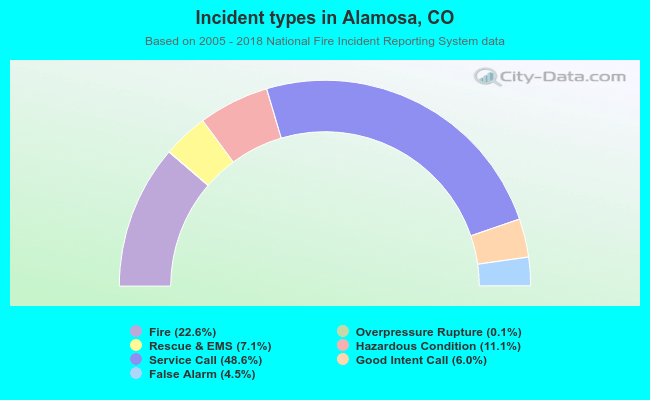 Out of all 4,172 cases reported during the years 2005 - 2018, the most belonged to the categories: Service Call (48.6%), Fire (22.6%), and Hazardous Condition (11.1%).
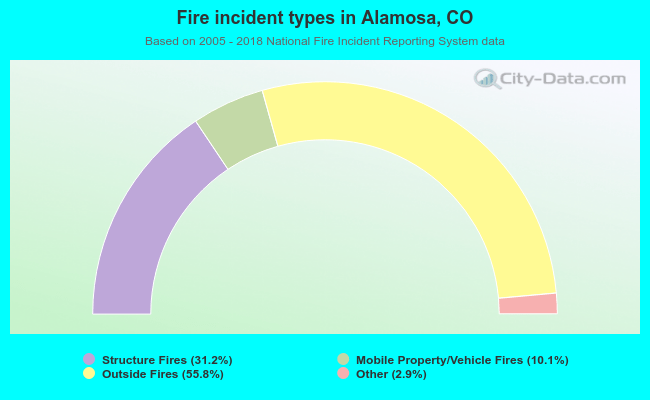 When looking into fire subcategories, the most incidents belonged to: Outside Fires (55.8%), and Structure Fires (31.2%).