Albia: Fire Incidents, Iowa (IA)
Where are fire incidents reported in Albia, IA
Something went wrong! Please refresh the page.
|
| |||||||||||||||||||||||||||||||||||||||||||||||||||||||||||||||||||||||||||||||||||||||||||||||||||||||||||||
| Other | 53 | |||||||||||||||||||||||||||||||||||||||||||||||||||||||||||||||||||||||||||||||||||||||||||||||||||||||||||||
2004 - 2018 National Fire Incident Reporting System (NFIRS) incidents
- Incident types reported to NFIRS in Albia, IA
- 44165.0%Fire
- 10215.0%Rescue & EMS
- 9113.4%Hazardous Condition
- 172.5%Service Call
- 121.8%Good Intent Call
- 101.5%False Alarm
- 30.4%Severe Weather
- 10.1%Overpressure Rupture
- 10.1%Special Incident
- Fire incident types reported to NFIRS in Albia, IA
- 22551.0%Outside Fires
- 11425.9%Structure Fires
- 7717.5%Mobile Property/Vehicle Fires
- 255.7%Other
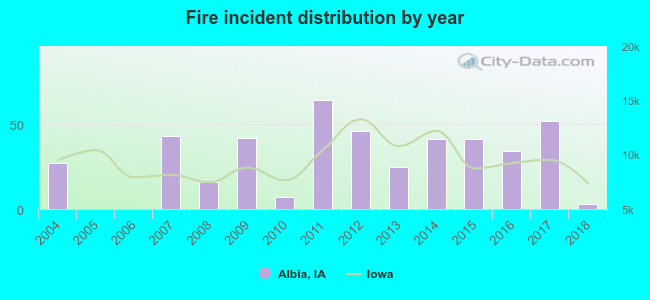 Based on the data from the years 2004 - 2018 the average number of fires per year is 29. The highest number of reported fire incidents - 64 took place in 2011, and the least - 0 in 2005. The data has a declining trend.
 30.6% incidents where reported in the morning and 69.4% in the evening. The most fires (20.2%) took place on Saturday, and the least (10.0%) on Thursday.
 According to the 441 fire incident reports from years 2004 - 2018 most fires (17.7%) took place during March, and the least (4.3%) in May.
 Out of all 678 cases reported during the years 2004 - 2018, the most belonged to the categories: Fire (65.0%), Rescue & EMS (15.0%), and Hazardous Condition (13.4%).
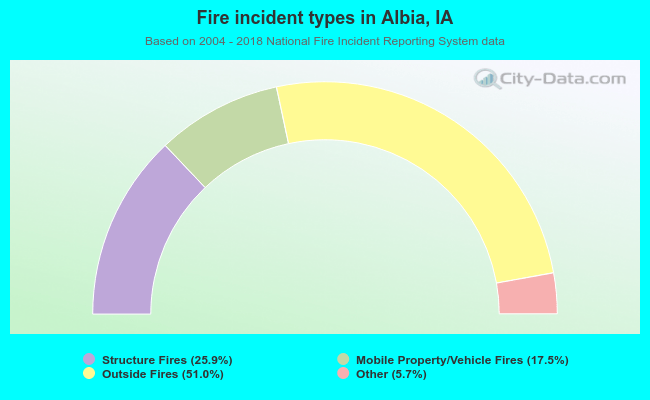 When looking into fire subcategories, the most incidents belonged to: Outside Fires (51.0%), and Structure Fires (25.9%).