Albin: Fire Incidents, Wyoming (WY)
Where are fire incidents reported in Albin, WY
Something went wrong! Please refresh the page.
|
| |||||||||||||||||||||||||||||||||||||||||||||||||||||||||||||||||||||||||||||||||||||
| Other | 59 | |||||||||||||||||||||||||||||||||||||||||||||||||||||||||||||||||||||||||||||||||||||
2002 - 2018 National Fire Incident Reporting System (NFIRS) incidents
- Incident types reported to NFIRS in Albin, WY
- 14747.4%Fire
- 9931.9%Rescue & EMS
- 278.7%Good Intent Call
- 216.8%Hazardous Condition
- 72.3%Service Call
- 61.9%False Alarm
- 20.6%Severe Weather
- 10.3%Overpressure Rupture
- Fire incident types reported to NFIRS in Albin, WY
- 10772.8%Outside Fires
- 1812.2%Structure Fires
- 1610.9%Mobile Property/Vehicle Fires
- 64.1%Other
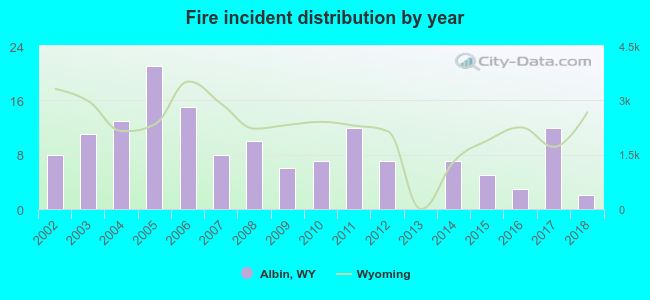 Based on the data from the years 2002 - 2018 the average number of fires per year is 9. The highest number of reported fire incidents - 21 took place in 2005, and the least - 0 in 2013. The data has a declining trend.
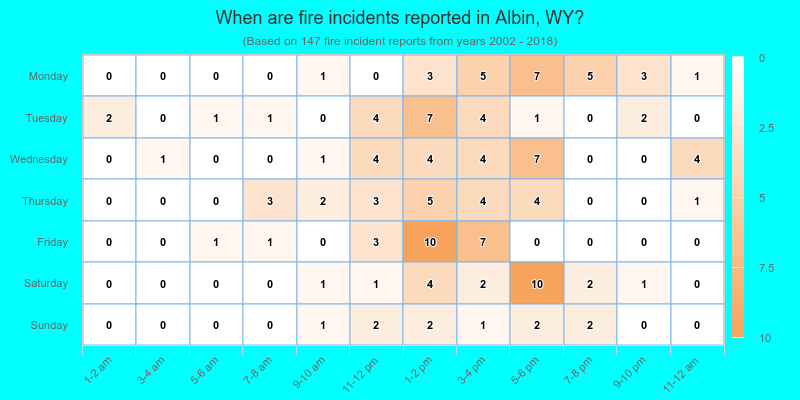
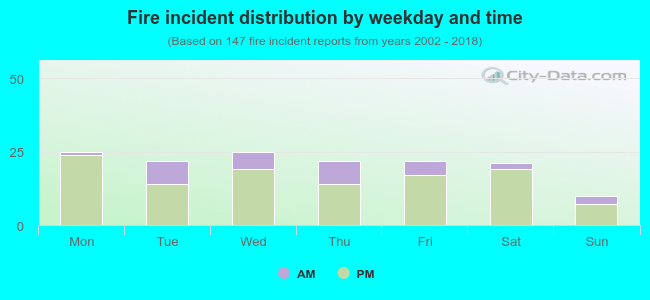 22.4% incidents where reported in the morning and 77.6% in the evening. The most fires (17.0%) took place on Monday, and the least (6.8%) on Sunday.
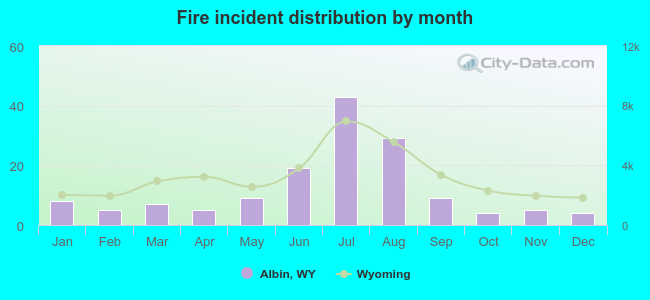 According to the 147 fire incident reports from years 2002 - 2018 most fires (29.3%) took place during July, and the least (2.7%) in October.
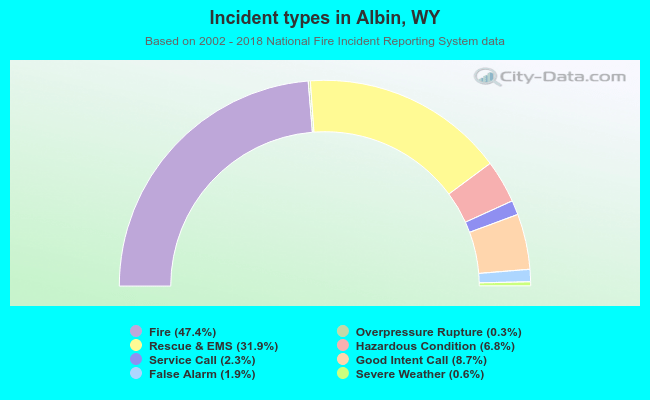 Out of all 310 cases reported during the years 2002 - 2018, the most belonged to the categories: Fire (47.4%), Rescue & EMS (31.9%), and Good Intent Call (8.7%).
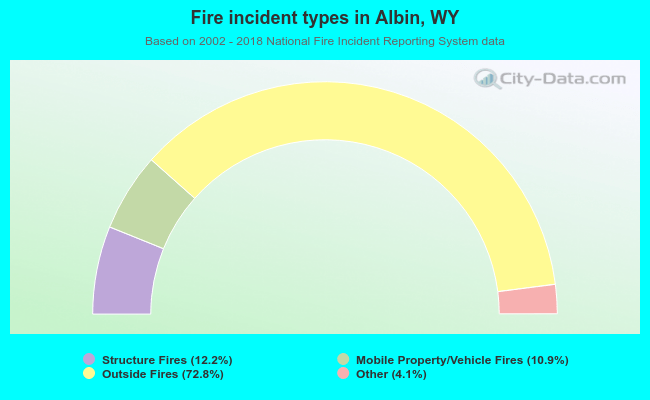 When looking into fire subcategories, the most incidents belonged to: Outside Fires (72.8%), and Structure Fires (12.2%).