Albuquerque: Fire Incidents, New Mexico (NM)
Where are fire incidents reported in Albuquerque, NM
Something went wrong! Please refresh the page.
| Fire incidents reported | |
|---|---|
| Sreet name | Count |
| CENTRAL AVE | 842 |
| CENTRAL AV | 634 |
| COORS BLVD | 460 |
| 2ND ST | 454 |
| 4TH ST | 440 |
| INDIAN SCHOOL RD | 356 |
| CANDELARIA RD | 348 |
| ST | 334 |
| I40 EASTBOUND | 324 |
| MONTGOMERY BL | 296 |
| ISLETA BLVD | 284 |
| MONTGOMERY BLVD | 276 |
| BROADWAY BLVD | 242 |
| I40 WESTBOUND | 242 |
| MENAUL BL | 232 |
| SAN PEDRO DR | 230 |
| COMANCHE RD | 226 |
| COORS BL | 226 |
| I25 NORTHBOUND | 222 |
| EDITH BLVD | 218 |
| PASEO DEL NORTE | 218 |
| SAN MATEO BL | 208 |
| LOMAS BL | 204 |
| LOUISIANA BL | 204 |
| 98TH ST | 196 |
| WYOMING BL | 190 |
| MENAUL BLVD | 188 |
| EUBANK BLVD | 184 |
| LOMAS BLVD | 176 |
| TRAMWAY BL | 176 |
| Other | 12,779 |
2003 - 2018 National Fire Incident Reporting System (NFIRS) incidents
- Incident types reported to NFIRS in Albuquerque, NM
- 257,65574.3%Rescue & EMS
- 35,77010.3%Good Intent Call
- 21,6096.2%Fire
- 13,0573.8%False Alarm
- 11,1673.2%Hazardous Condition
- 5,5321.6%Service Call
- 1,0690.3%Overpressure Rupture
- 8010.2%Special Incident
- Fire incident types reported to NFIRS in Albuquerque, NM
- 8,73040.4%Outside Fires
- 8,04037.2%Structure Fires
- 3,48716.1%Mobile Property/Vehicle Fires
- 1,3526.3%Other
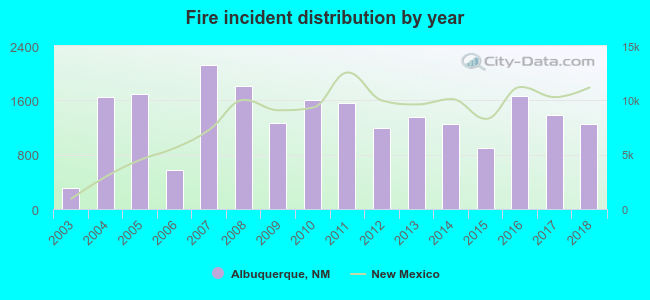 Based on the data from the years 2003 - 2018 the average number of fires per year is 1,350. The highest number of reported fire incidents - 2,126 took place in 2007, and the least - 313 in 2003. The data has an increasing trend.
The average number of yearly fire incidents per 10k residents in Albuquerque, NM compared to nearest cities:
(Note: Based on data for the last 3 years, including only cities with population 5,000 and above)
| Albuquerque: | 25.7 |
| North Valley: | 4.1 |
| South Valley: | 2.0 |
| Corrales: | 18.3 |
| Rio Rancho: | 17.1 |
| Bernalillo: | 39.3 |
| Los Lunas: | 192.2 |
| Los Chaves: | 28.8 |
| Belen: | 195.1 |
 The median response time based on all reported fire incidents is 7 minutes. This is about the same as the New Mexico median value.
The median response time in Albuquerque, NM compared to nearest cities:
(Note: Based on data for all years, including only cities with at least 500 fire incidents)
| Albuquerque: | 7 minutes |
| Rio Rancho: | 8 minutes |
| Tijeras: | 11 minutes |
| Los Lunas: | 10 minutes |
| Edgewood: | 12 minutes |
| Belen: | 10 minutes |
| Moriarty: | 12 minutes |
| Jarales: | 11 minutes |
 According to the reports from the years 2003 - 2018 the average number of fire-related yearly deaths is 1. The highest number of reported deaths - 4 took place in 2013, and the lowest - 0 in 2003. The data has a rising trend.
The average number of fatalities per 1,000 fires is 1. This indicator was the highest - 3 in 2013, and the lowest 0 in 2003. The trend for fatalities per 1,000 fires is growing. Compared to the New Mexico value the number of deaths per 1,000 incidents is much lower.
According to the reports from the years 2003 - 2018 the average number of fire-related yearly deaths is 1. The highest number of reported deaths - 4 took place in 2013, and the lowest - 0 in 2003. The data has a rising trend.
The average number of fatalities per 1,000 fires is 1. This indicator was the highest - 3 in 2013, and the lowest 0 in 2003. The trend for fatalities per 1,000 fires is growing. Compared to the New Mexico value the number of deaths per 1,000 incidents is much lower.Deaths per 1,000 incidents in Albuquerque, NM compared to nearest cities:
(Note: Based on data for all years, including only cities with at least 2,500 fire incidents)
| Albuquerque: | 0.7 |
| Los Lunas: | 1.2 |
 According to the data from the years 2003 - 2018 the average number of fire-related casualties per year is 4. The highest number of reported injuries - 10 took place in 2018, and the lowest - 0 in 2004. The data has a growing trend.
The average number of injuries per 1,000 fires is 3. This indicator was the highest - 9 in 2015, and the lowest 0 in 2004. The trend for casualties per 1,000 fires is increasing. Compared to the New Mexico value the number of casualties per 1,000 fires is higher.
According to the data from the years 2003 - 2018 the average number of fire-related casualties per year is 4. The highest number of reported injuries - 10 took place in 2018, and the lowest - 0 in 2004. The data has a growing trend.
The average number of injuries per 1,000 fires is 3. This indicator was the highest - 9 in 2015, and the lowest 0 in 2004. The trend for casualties per 1,000 fires is increasing. Compared to the New Mexico value the number of casualties per 1,000 fires is higher.
 33.2% incidents where reported in the morning and 66.8% in the evening. The most fires (15.5%) took place on Saturday, and the least (13.4%) on Tuesday.
 According to the 21,609 fires from years 2003 - 2018 most fires (11.4%) took place during June, and the least (6.0%) in September.
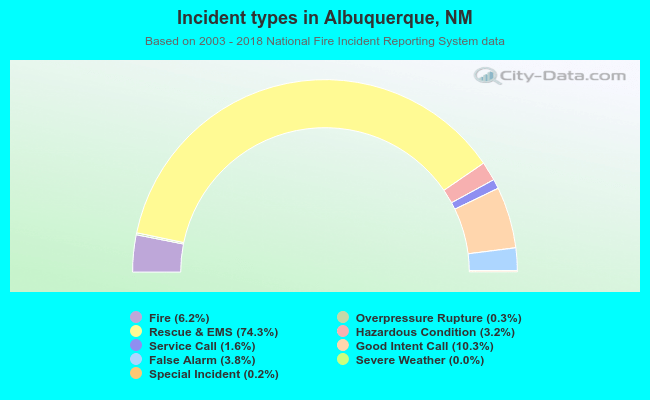 Out of all 346,683 cases reported during the years 2003 - 2018, the most belonged to the categories: Rescue & EMS (74.3%), Good Intent Call (10.3%), and Fire (6.2%).
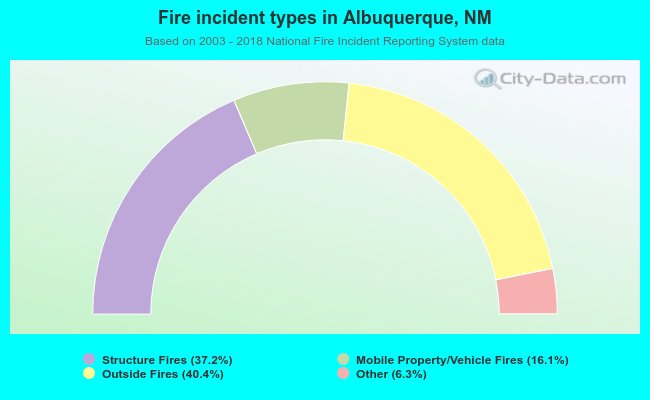 When looking into fire subcategories, the most incidents belonged to: Outside Fires (40.4%), and Structure Fires (37.2%).