Algood: Fire Incidents, Tennessee (TN)
Where are fire incidents reported in Algood, TN
Something went wrong! Please refresh the page.
|
| |||||||||||||||||||||||||||||||||||||||||||||||||||||||||||||||||||||||||||||||||||||||||||||||||||||||||||||
2002 - 2018 National Fire Incident Reporting System (NFIRS) incidents
- Incident types reported to NFIRS in Algood, TN
- 48542.5%Rescue & EMS
- 24121.1%Fire
- 15313.4%Hazardous Condition
- 1139.9%False Alarm
- 907.9%Service Call
- 413.6%Good Intent Call
- 111.0%Special Incident
- 70.6%Severe Weather
- Fire incident types reported to NFIRS in Algood, TN
- 9338.6%Outside Fires
- 8836.5%Structure Fires
- 4619.1%Mobile Property/Vehicle Fires
- 145.8%Other
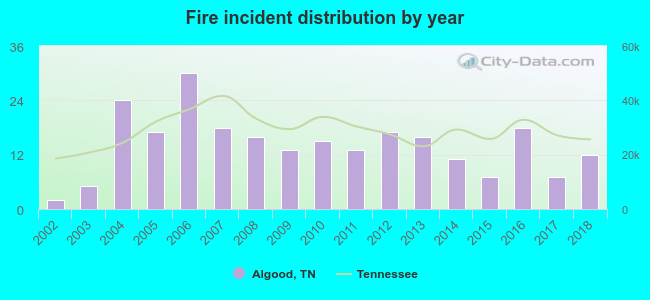 Based on the data from the years 2002 - 2018 the average number of fire incidents per year is 14. The highest number of reported fires - 30 took place in 2006, and the least - 2 in 2002. The data has a rising trend.
 Based on the data from the years 2002 - 2018 the average number of fire-related yearly casualties is 0. The highest number of injuries - 2 took place in 2006, and the lowest - 0 in 2002. The data has a rising trend.
 39.8% incidents where reported in the morning and 60.2% in the evening. The most fires (17.4%) took place on Friday, and the least (9.5%) on Sunday.
 According to the 241 incident reports from years 2002 - 2018 most fires (14.5%) took place during March, and the least (5.0%) in August.
 Out of all 1,141 cases reported during the years 2002 - 2018, the most belonged to the categories: Overpressure Rupture (42.5%), Fire (21.1%), and Rescue & EMS (13.4%).
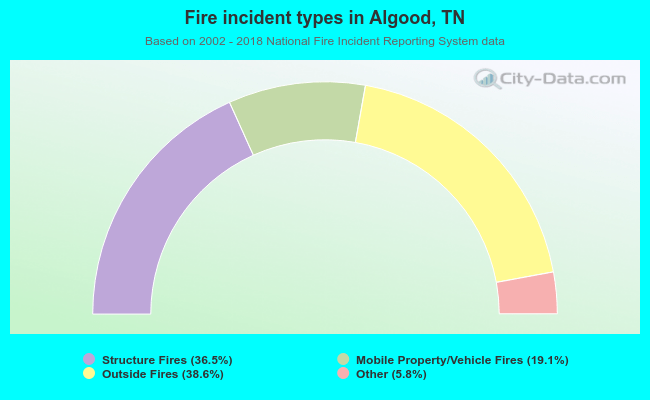 When looking into fire subcategories, the most reports belonged to: Outside Fires (38.6%), and Structure Fires (36.5%).