Aliso Viejo: Fire Incidents, California (CA)
Where are fire incidents reported in Aliso Viejo, CA
Something went wrong! Please refresh the page.
|
| |||||||||||||||||||||||||||||||||||||||||||||||||||||||||||||||||||||||||||||||||||||||||||||||||||||||||||||
2005 - 2018 National Fire Incident Reporting System (NFIRS) incidents
- Incident types reported to NFIRS in Aliso Viejo, CA
- 7,33169.5%Rescue & EMS
- 9579.1%Good Intent Call
- 8788.3%False Alarm
- 5305.0%Service Call
- 4814.6%Fire
- 3393.2%Hazardous Condition
- 200.2%Overpressure Rupture
- Fire incident types reported to NFIRS in Aliso Viejo, CA
- 17135.6%Structure Fires
- 16935.1%Outside Fires
- 9118.9%Mobile Property/Vehicle Fires
- 5010.4%Other
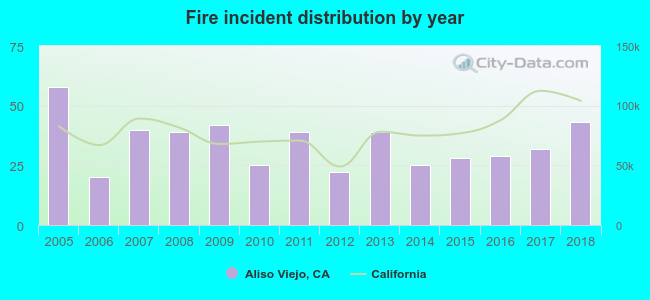 According to the data from the years 2005 - 2018 the average number of fires per year is 34. The highest number of reported fire incidents - 58 took place in 2005, and the least - 20 in 2006. The data has a dropping trend.
The average number of yearly fire incidents per 10k residents in Aliso Viejo, CA compared to nearest cities:
(Note: Based on data for the last 3 years, including only cities with population 5,000 and above)
| Aliso Viejo: | 6.9 |
| Laguna Hills: | 15.7 |
| Laguna Woods: | 12.8 |
| Laguna Niguel: | 7.1 |
| Laguna Beach: | 4.1 |
| South Coast: | 0.4 |
| Mission Viejo: | 9.2 |
| Lake Forest: | 1.0 |
| Ladera Ranch: | 1.1 |

 Based on the reports from the years 2005 - 2018 the average number of fire-related casualties per year is 1. The highest number of reported injuries - 4 took place in 2018, and the lowest - 0 in 2005. The data has a growing trend.
 27.9% incidents where reported in the morning and 72.1% in the evening. The most fires (16.4%) took place on Monday, and the least (12.7%) on Wednesday.
 According to the 481 fire incidents from years 2005 - 2018 most fires (10.4%) took place during May, and the least (6.0%) in September.
 Out of all 10,546 cases reported during the years 2005 - 2018, the most belonged to the categories: Rescue & EMS (69.5%), Good Intent Call (9.1%), and False Alarm (8.3%).
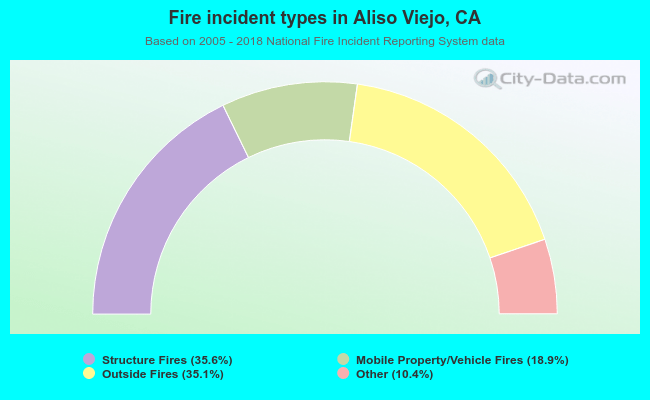 When looking into fire subcategories, the most reports belonged to: Structure Fires (35.6%), and Outside Fires (35.1%).