| Fire incidents reported |
|---|
| Sreet name | Count |
|---|
| K99 | 46 | | I70 | 22 | | INTERSTATE 70 HWY | 8 | | WAB RD | 8 | | 30007 WABAUNSEE RD | 6 | | ANTELOPE CREEK RD | 6 | | SKYLINE RD | 6 | | WABAUNSEE RD | 6 | | 1 ST | 4 | | 23436 K99 HWY | 4 | | 27450 BURR OAK RD. | 4 | | 28173 HOMESTEAD RD | 4 | | 29016 OLD K10 RD. | 4 | | 29196 CEDAR POINT RD. | 4 | | 31068 OLD K10 RD | 4 | | 31600 WABAUNSEE RD. | 4 | | 32832 OLD K10 RD | 4 | | 78 LAKEVIEW | 4 | | GOOSEBERRY RD | 4 | | HESSDALE RD | 4 | | ILLINOIS CREEK RD | 4 | | K99 HWY | 4 | | OLD K10 RD | 4 | | TALL GRASS RD | 4 | | 100 MISSOURI | 2 |
| | | Fire incidents reported |
|---|
| Sreet name | Count |
|---|
| 107 IOWA | 2 | | 107 MISSOURI ST | 2 | | 122 W 1ST | 2 | | 18749 K99 | 2 | | 1ST | 2 | | 20361 ILLINOIS CREEK RD | 2 | | 206 W 2ND | 2 | | 209 E. 3RD | 2 | | 211 IOWA | 2 | | 215 E 7TH | 2 | | 225 IOWA ST | 2 | | 22727 NEHRING BRANCH RD | 2 | | 23217 ILLINOIS CREEK RD | 2 | | 234 MANOR CIRCLE | 2 | | 24038 K99 HWY | 2 | | 24095 HESSDALE RD. | 2 | | 24775 ILLINOIS CREEK RD | 2 | | 25096 NEHRING BRANCH RD. | 2 | | 25929 ILLINOIS CREEK RD. | 2 | | 26955 HESSDALE RD. | 2 | | 26956 CLAPBOARD RD | 2 | | 27350 SKYLINE RD. | 2 | | 27356 BISON RD | 2 | | 27765 FAIRFIELD RD. | 2 | | |
|
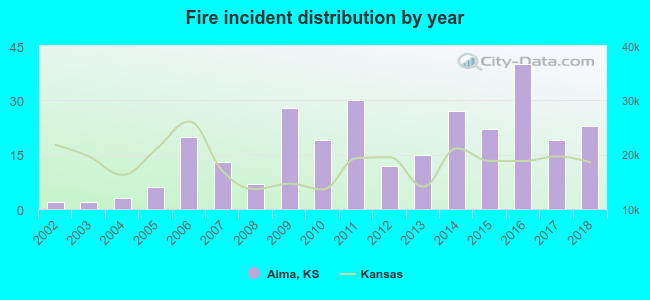 Based on the data from the years 2002 - 2018 the average number of fires per year is 17. The highest number of fire incidents - 40 took place in 2016, and the least - 2 in 2002. The data has an increasing trend.
 22.2% incidents where reported in the morning and 77.8% in the evening. The most fires (19.8%) took place on Tuesday, and the least (10.4%) on Thursday.
 Based on the 288 fire incident reports from years 2002 - 2018 most fires (27.4%) took place during April, and the least (1.7%) in May.
 Out of all 480 cases reported during the years 2002 - 2018, the most belonged to the categories: Fire (60.0%), Overpressure Rupture (31.5%), and Service Call (3.8%).
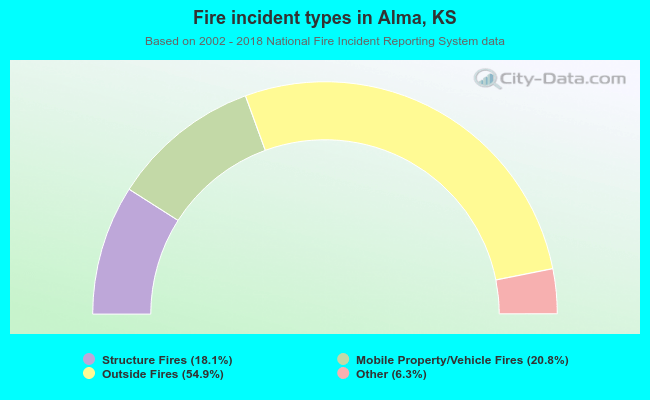 When looking into fire subcategories, the most incidents belonged to: Outside Fires (54.9%), and Mobile Property/Vehicle Fires (20.8%).