Alpine: Fire Incidents, Utah (UT)
Where are fire incidents reported in Alpine, UT
Something went wrong! Please refresh the page.
|
| |||||||||||||||||||||||||||||||||||||||||||||||||||||||||||||||||||||||||||||||||||||||||||||||||||||||||||||
2002 - 2018 National Fire Incident Reporting System (NFIRS) incidents
- Incident types reported to NFIRS in Alpine, UT
- 19825.3%Good Intent Call
- 15820.2%Fire
- 15820.2%False Alarm
- 14718.8%Rescue & EMS
- 9712.4%Hazardous Condition
- 222.8%Service Call
- 20.3%Severe Weather
- 20.3%Special Incident
- Fire incident types reported to NFIRS in Alpine, UT
- 7849.4%Outside Fires
- 4830.4%Structure Fires
- 2113.3%Other
- 117.0%Mobile Property/Vehicle Fires
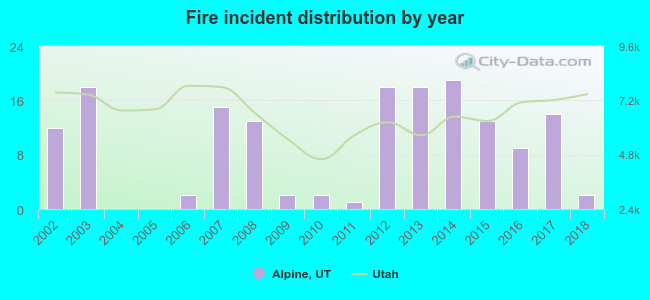 Based on the data from the years 2002 - 2018 the average number of fire incidents per year is 9. The highest number of reported fire incidents - 19 took place in 2014, and the least - 0 in 2004. The data has a dropping trend.
The average number of yearly fire incidents per 10k residents in Alpine, UT compared to nearest cities:
(Note: Based on data for the last 3 years, including only cities with population 5,000 and above)
| Alpine: | 8.2 |
| Highland: | 7.4 |
| Cedar Hills: | 5.8 |
| American Fork: | 16.9 |
| Lehi: | 16.5 |
| Pleasant Grove: | 12.9 |
| Draper: | 16.0 |
| Lindon: | 20.8 |
| Bluffdale: | 21.2 |
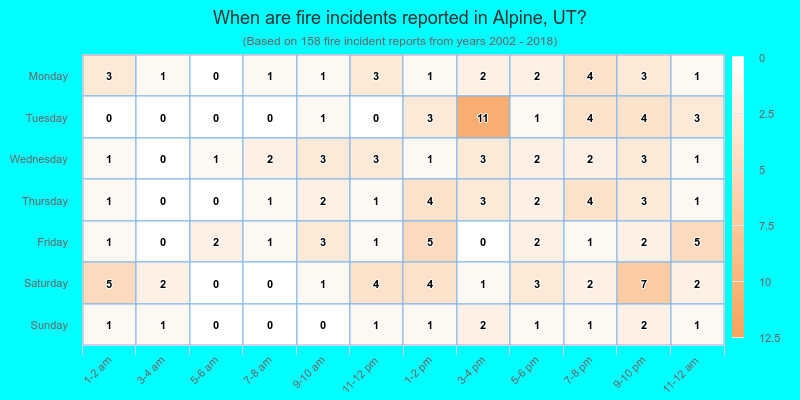
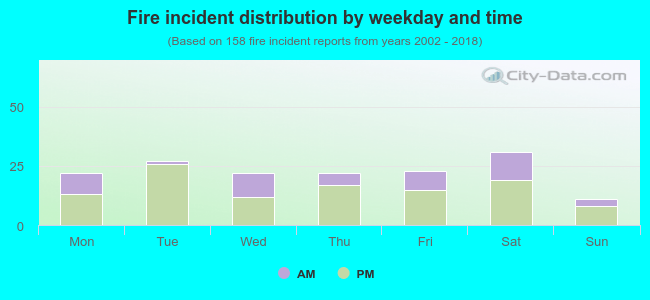 30.4% incidents where reported in the morning and 69.6% in the evening. The most fires (19.6%) took place on Saturday, and the least (7.0%) on Sunday.
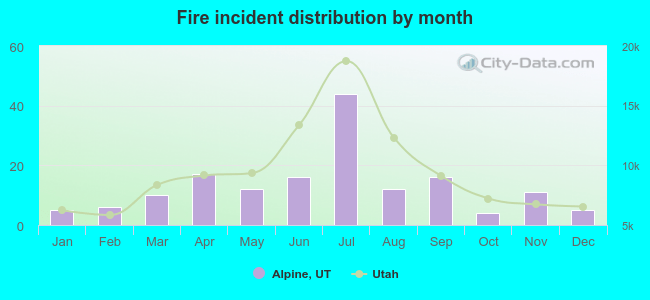 Based on the 158 reports from years 2002 - 2018 most fires (27.8%) took place during July, and the least (2.5%) in October.
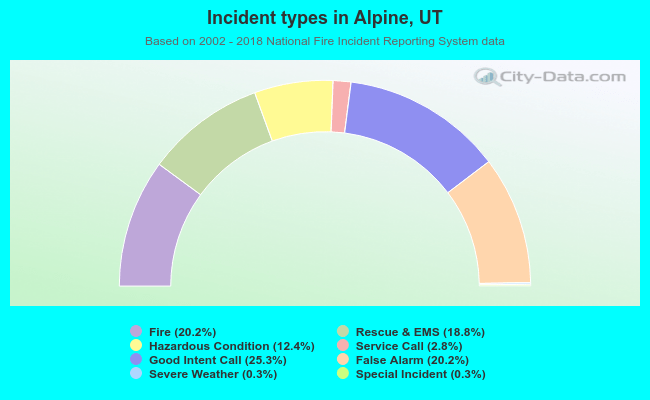 Out of all 784 cases reported during the years 2002 - 2018, the most belonged to the categories: Service Call (25.3%), Fire (20.2%), and Good Intent Call (20.2%).
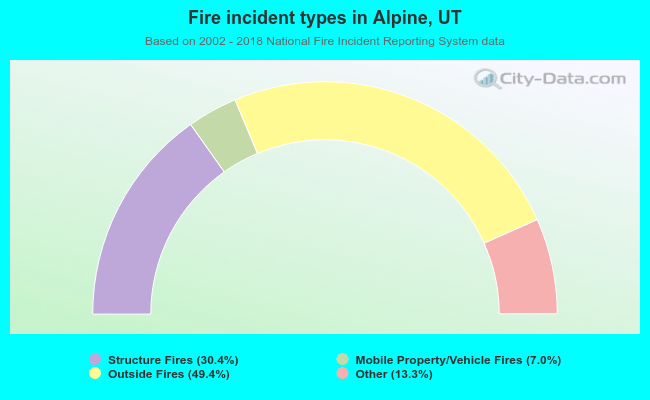 When looking into fire subcategories, the most incidents belonged to: Outside Fires (49.4%), and Structure Fires (30.4%).