Amarillo: Fire Incidents, Texas (TX)
Where are fire incidents reported in Amarillo, TX
Something went wrong! Please refresh the page.
| Fire incidents reported | |
|---|---|
| Sreet name | Count |
| AMARILLO BLVD | 982 |
| INTERSTATE 40 | 466 |
| VIRGINIA ST | 410 |
| WESTERN ST | 410 |
| 10TH AVE | 406 |
| WASHINGTON ST | 392 |
| BELL ST | 358 |
| GRAND ST | 340 |
| CANYON DR | 330 |
| POLK ST | 326 |
| 11TH AVE | 274 |
| 3RD AVE | 256 |
| 9TH AVE | 254 |
| 34TH AVE | 244 |
| 15TH AVE | 238 |
| ADAMS ST | 234 |
| GEORGIA ST | 232 |
| IH 40 INT | 224 |
| TYLER ST | 218 |
| ARTHUR ST | 202 |
| 12TH AVE | 200 |
| BUCHANAN ST | 192 |
| 45TH AVE | 190 |
| 14TH AVE | 188 |
| HUGHES ST | 186 |
| 40 | 180 |
| TAYLOR ST | 180 |
| JACKSON ST | 176 |
| HARRISON ST | 174 |
| AUSTIN ST | 172 |
| Other | 12,367 |
2002 - 2018 National Fire Incident Reporting System (NFIRS) incidents
- Incident types reported to NFIRS in Amarillo, TX
- 73,42555.9%Rescue & EMS
- 21,00116.0%Fire
- 15,30011.7%Good Intent Call
- 12,4259.5%Hazardous Condition
- 5,9284.5%False Alarm
- 3,0712.3%Service Call
- Fire incident types reported to NFIRS in Amarillo, TX
- 10,77851.3%Outside Fires
- 7,20334.3%Structure Fires
- 2,76713.2%Mobile Property/Vehicle Fires
- 2531.2%Other
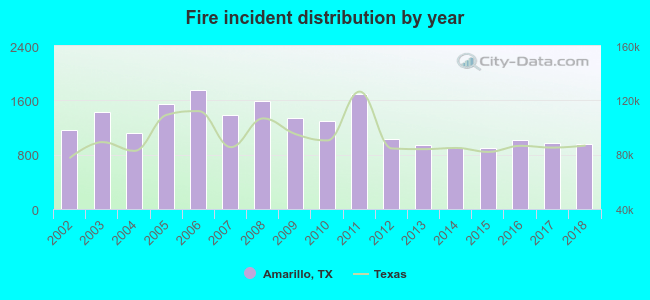 According to the data from the years 2002 - 2018 the average number of fires per year is 1,235. The highest number of fire incidents - 1,747 took place in 2006, and the least - 894 in 2015. The data has a decreasing trend.
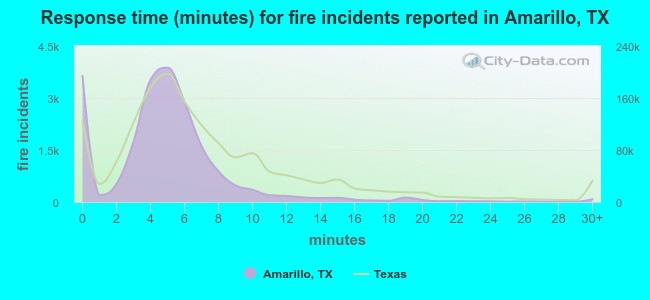 The median response time based on all reported fire incidents is 5 minutes. This is lower compared to the state median value.
The median response time in Amarillo, TX compared to nearest cities:
(Note: Based on data for all years, including only cities with at least 500 fire incidents)
| Amarillo: | 5 minutes |
| Canyon: | 9 minutes |
| Panhandle: | 14 minutes |
| Fritch: | 8 minutes |
| Borger: | 5 minutes |
| Hereford: | 6 minutes |
| Tulia: | 9 minutes |
| Dumas: | 6 minutes |
| Pampa: | 4 minutes |
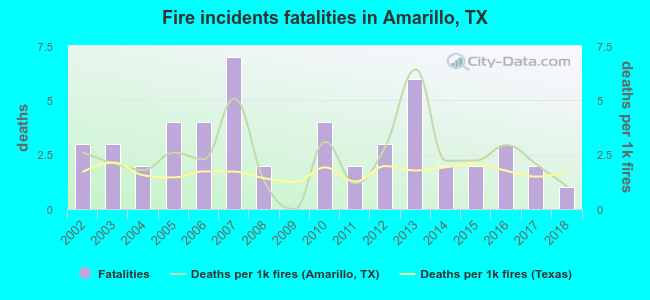 According to the reports from the years 2002 - 2018 the average number of fire-related fatalities per year is 3. The highest number of deaths - 7 took place in 2007, and the lowest - 0 in 2009. The data has a dropping trend.
The average number of deaths per 1,000 fire incidents is 2. This indicator was the highest - 6 in 2013, and the lowest 0 in 2009. The trend for deaths per 1,000 incidents is declining. Compared to the state value the number of deaths per 1,000 fires is higher.
According to the reports from the years 2002 - 2018 the average number of fire-related fatalities per year is 3. The highest number of deaths - 7 took place in 2007, and the lowest - 0 in 2009. The data has a dropping trend.
The average number of deaths per 1,000 fire incidents is 2. This indicator was the highest - 6 in 2013, and the lowest 0 in 2009. The trend for deaths per 1,000 incidents is declining. Compared to the state value the number of deaths per 1,000 fires is higher.Deaths per 1,000 incidents in Amarillo, TX compared to nearest cities:
(Note: Based on data for all years, including only cities with at least 2,500 fire incidents)
| Amarillo: | 2.4 |
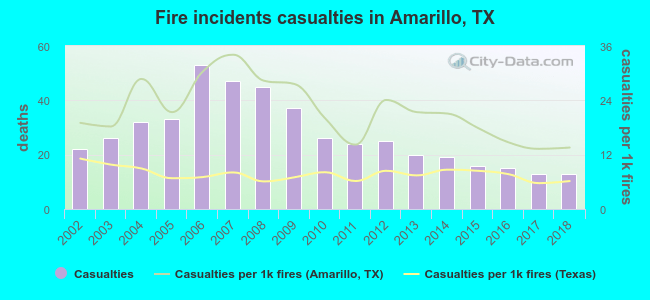 Based on the reports from the years 2002 - 2018 the average number of fire-related casualties per year is 27. The highest number of casualties - 53 took place in 2006, and the lowest - 13 in 2017. The data has a dropping trend.
The average number of casualties per 1,000 fire incidents is 22. This indicator was the highest - 34 in 2007, and the lowest 13 in 2017. The trend for injuries per 1,000 incidents is declining. Compared to the state value the number of casualties per 1,000 incidents is much higher.
Based on the reports from the years 2002 - 2018 the average number of fire-related casualties per year is 27. The highest number of casualties - 53 took place in 2006, and the lowest - 13 in 2017. The data has a dropping trend.
The average number of casualties per 1,000 fire incidents is 22. This indicator was the highest - 34 in 2007, and the lowest 13 in 2017. The trend for injuries per 1,000 incidents is declining. Compared to the state value the number of casualties per 1,000 incidents is much higher.
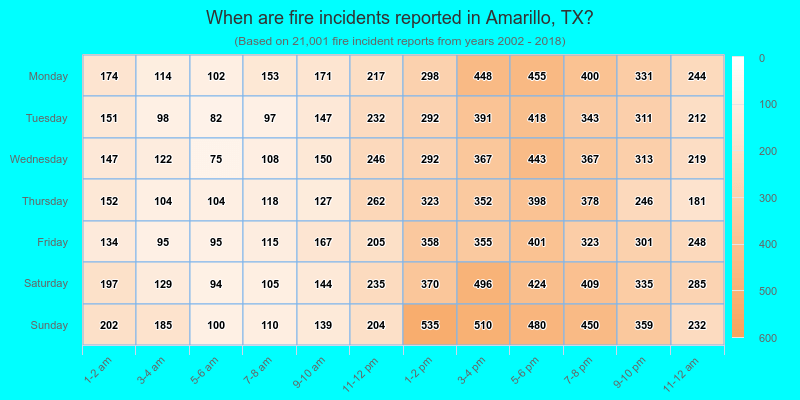
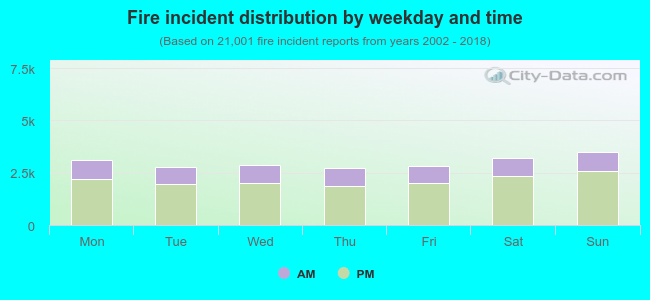 29.1% incidents where reported in the morning and 70.9% in the evening. The most fires (16.7%) took place on Sunday, and the least (13.1%) on Thursday.
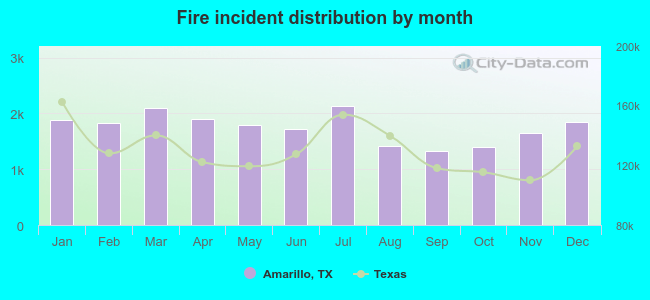 According to the 21,001 fire incident reports from years 2002 - 2018 most fires (10.2%) took place during July, and the least (6.3%) in September.
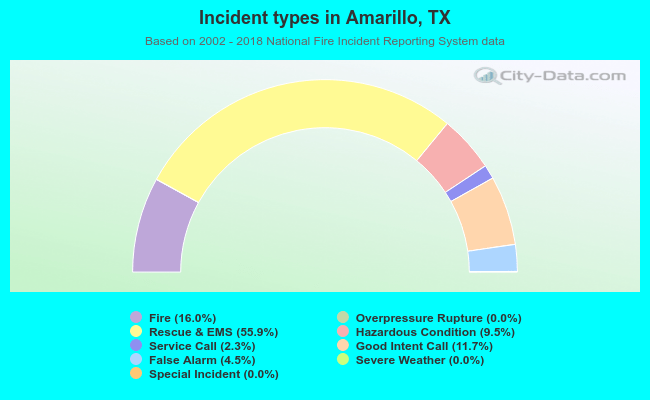 Out of all 131,312 cases reported during the years 2002 - 2018, the most belonged to the categories: Rescue & EMS (55.9%), Fire (16.0%), and Good Intent Call (11.7%).
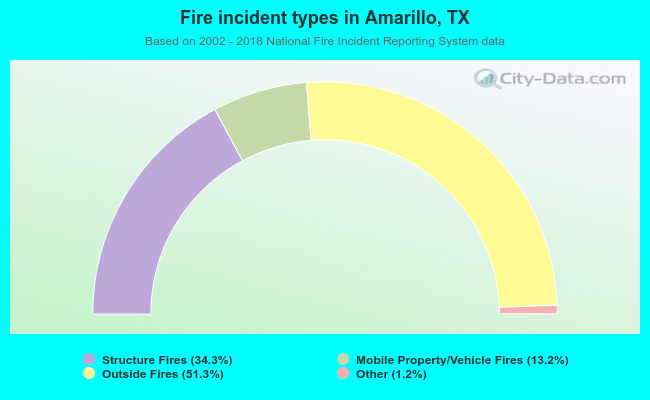 When looking into fire subcategories, the most incidents belonged to: Outside Fires (51.3%), and Structure Fires (34.3%).