Ambler: Fire Incidents, Pennsylvania (PA)
Where are fire incidents reported in Ambler, PA
Something went wrong! Please refresh the page.
|
| |||||||||||||||||||||||||||||||||||||||||||||||||||||||||||||||||||||||||||||||||||||||||||||||||||||||||||||
2004 - 2018 National Fire Incident Reporting System (NFIRS) incidents
- Incident types reported to NFIRS in Ambler, PA
- 28639.2%Fire
- 20528.1%Hazardous Condition
- 14119.3%False Alarm
- 385.2%Good Intent Call
- 283.8%Service Call
- 172.3%Rescue & EMS
- 141.9%Special Incident
- Fire incident types reported to NFIRS in Ambler, PA
- 21173.8%Structure Fires
- 4214.7%Outside Fires
- 227.7%Mobile Property/Vehicle Fires
- 113.8%Other
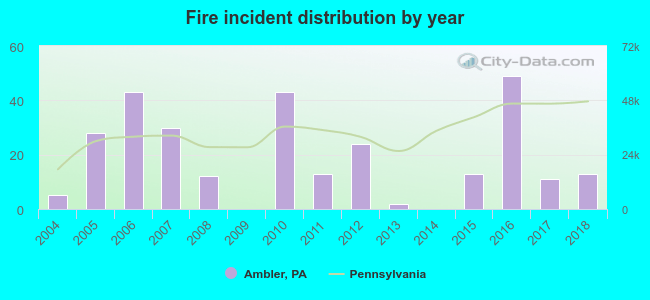 According to the data from the years 2004 - 2018 the average number of fires per year is 19. The highest number of reported fire incidents - 49 took place in 2016, and the least - 0 in 2009. The data has an increasing trend.
The average number of yearly fire incidents per 10k residents in Ambler, PA compared to nearest cities:
(Note: Based on data for the last 3 years, including only cities with population 5,000 and above)
| Ambler: | 37.4 |
| Fort Washington: | 36.1 |
| Maple Glen: | 3.0 |
| Blue Bell: | 16.5 |
| Oreland: | 24.7 |
| Plymouth Meeting: | 33.5 |
| Horsham: | 23.8 |
| Glenside: | 70.8 |
| Wyndmoor: | 41.2 |
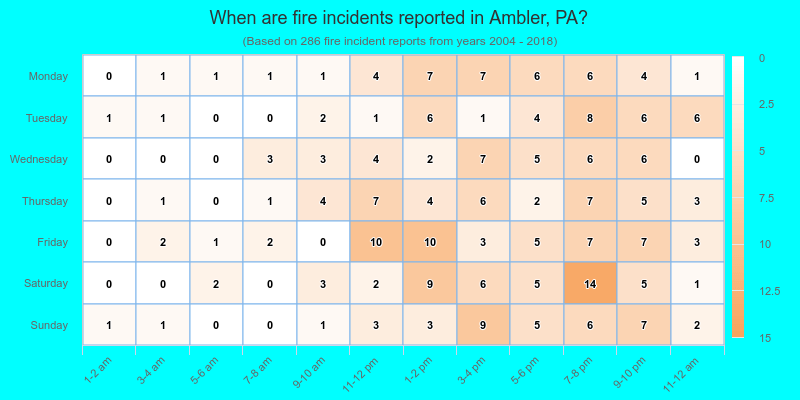
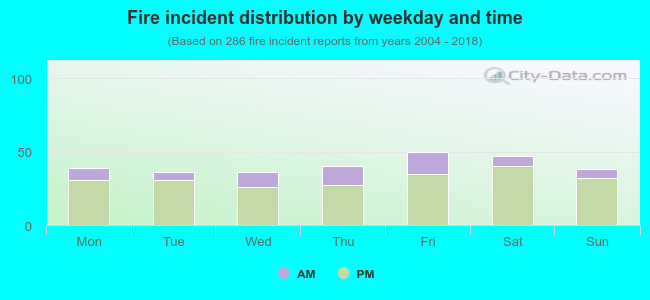 22.4% incidents where reported in the morning and 77.6% in the evening. The most fires (17.5%) took place on Friday, and the least (12.6%) on Tuesday.
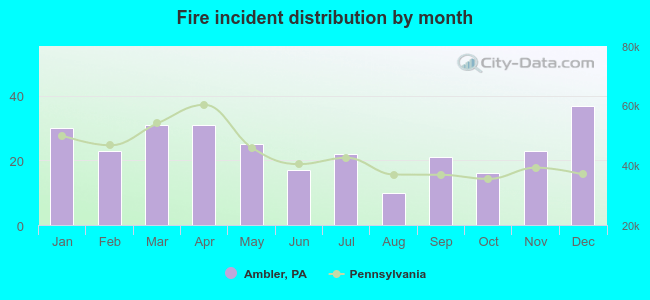 Based on the 286 fire incident reports from years 2004 - 2018 most fires (12.9%) took place during December, and the least (3.5%) in August.
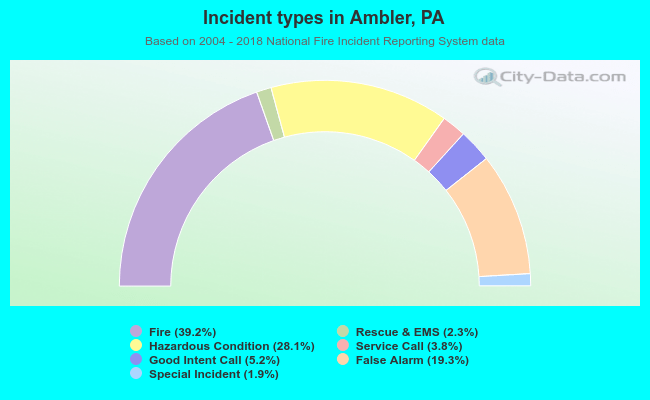 Out of all 729 cases reported during the years 2004 - 2018, the most belonged to the categories: Fire (39.2%), Rescue & EMS (28.1%), and Good Intent Call (19.3%).
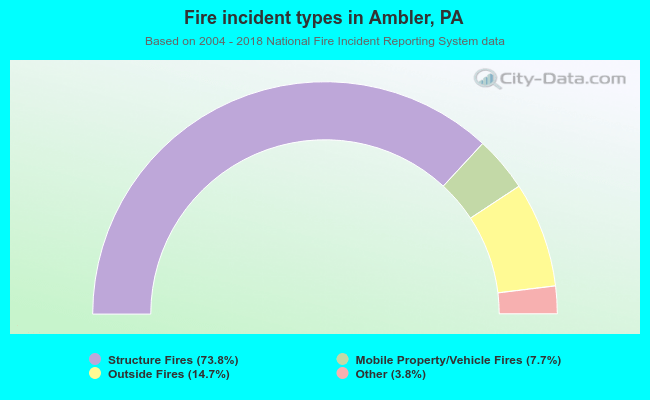 When looking into fire subcategories, the most reports belonged to: Structure Fires (73.8%), and Outside Fires (14.7%).