Amherst: Fire Incidents, New York (NY)
Where are fire incidents reported in Amherst, NY
Something went wrong! Please refresh the page.
| Fire incidents reported | |
|---|---|
| Sreet name | Count |
| NIAGARA FALLS BLVD | 184 |
| MAIN ST | 160 |
| SHERIDAN DR | 150 |
| NIAGARA FALLS BLVD | 146 |
| MEYER RD | 104 |
| MAPLE RD | 88 |
| TRANSIT RD | 64 |
| EGGERT RD | 62 |
| MAPLE RD | 60 |
| NIAGARA FALLS BLVD. | 58 |
| MILLERSPORT HWY | 56 |
| ALBERTA DR | 54 |
| ALLENHURST RD | 40 |
| SWEETHOME RD | 40 |
| JOHN JAMES AUDUBON PKWY | 38 |
| AUGSBURGER RD. | 34 |
| HERRON DR | 34 |
| BAILEY AVE | 32 |
| FLINT RD | 32 |
| LEBRUN RD | 28 |
| NORTH FOREST RD | 28 |
| SPRINGVILLE AVE | 28 |
| SWEETHOME RD. | 26 |
| CROSBY BLVD | 24 |
| EISS PL | 24 |
| SHERIDAN DR | 24 |
| SHERIDAN DRIVE | 24 |
| WINDERMERE BLVD | 24 |
| PUTNAM WAY | 22 |
| BAILEY AVE N | 20 |
| Other | 425 |
2002 - 2018 National Fire Incident Reporting System (NFIRS) incidents
- Incident types reported to NFIRS in Amherst, NY
- 10,70053.7%Rescue & EMS
- 3,57718.0%False Alarm
- 2,13310.7%Fire
- 1,8959.5%Hazardous Condition
- 8394.2%Service Call
- 7043.5%Good Intent Call
- 310.2%Overpressure Rupture
- 270.1%Special Incident
- Fire incident types reported to NFIRS in Amherst, NY
- 85139.9%Structure Fires
- 67131.5%Outside Fires
- 31514.8%Other
- 29613.9%Mobile Property/Vehicle Fires
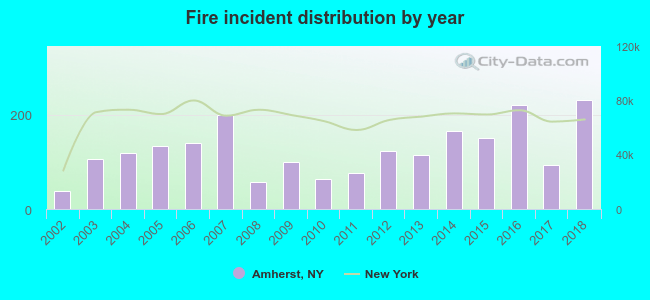 Based on the data from the years 2002 - 2018 the average number of fire incidents per year is 125. The highest number of reported fires - 231 took place in 2018, and the least - 38 in 2002. The data has an increasing trend.
The average number of yearly fire incidents per 10k residents in Amherst, NY compared to nearest cities:
(Note: Based on data for the last 3 years, including only cities with population 5,000 and above)
| Amherst: | 14.9 |
| Williamsville: | 100.3 |
| Eggertsville: | 1.0 |
| Cheektowaga: | 32.4 |
| Kenmore: | 21.9 |
| Tonawanda: | 81.5 |
| Clarence: | 7.6 |
| North Tonawanda: | 27.1 |
| Depew: | 28.7 |
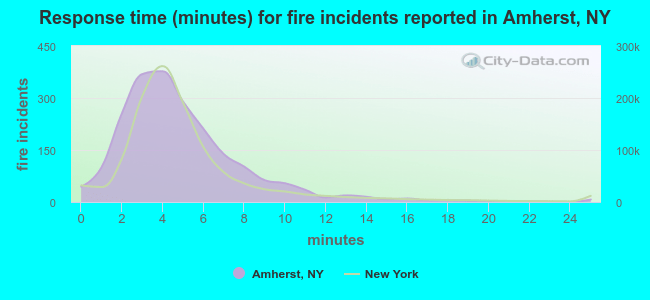 The median response time based on all reported fire incidents is 4 minutes. This is close to the New York median value.
The median response time in Amherst, NY compared to nearest cities:
(Note: Based on data for all years, including only cities with at least 500 fire incidents)
| Amherst: | 4 minutes |
| Williamsville: | 4 minutes |
| Cheektowaga: | 4 minutes |
| Kenmore: | 2 minutes |
| Tonawanda: | 2 minutes |
| North Tonawanda: | 3 minutes |
| Depew: | 3 minutes |
| Buffalo: | 3 minutes |
| Lancaster: | 0 minutes |
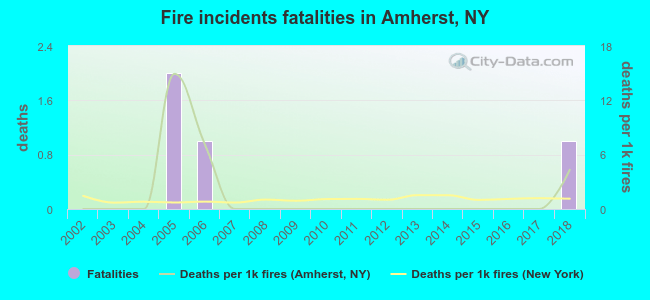 According to the reports from the years 2002 - 2018 the average number of fire-related yearly deaths is 0. The highest number of deaths - 2 took place in 2005, and the lowest - 0 in 2002. The data has a growing trend.
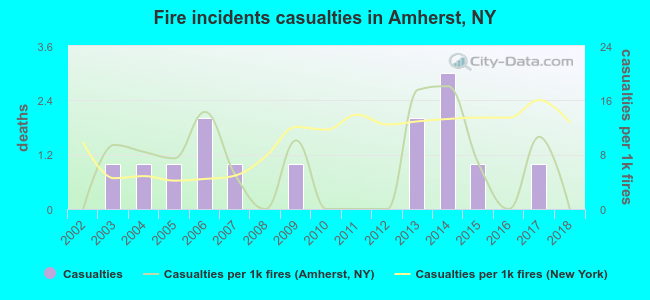 Based on the reports from the years 2002 - 2018 the average number of fire-related casualties per year is 1. The highest number of reported casualties - 3 took place in 2014, and the lowest - 0 in 2002. The data has a constant trend.
The average number of casualties per 1,000 fires is 6. This indicator was the highest - 18 in 2014, and the lowest 0 in 2002. The trend for injuries per 1,000 incidents is growing. Compared to the state value the number of casualties per 1,000 fires is lower.
Based on the reports from the years 2002 - 2018 the average number of fire-related casualties per year is 1. The highest number of reported casualties - 3 took place in 2014, and the lowest - 0 in 2002. The data has a constant trend.
The average number of casualties per 1,000 fires is 6. This indicator was the highest - 18 in 2014, and the lowest 0 in 2002. The trend for injuries per 1,000 incidents is growing. Compared to the state value the number of casualties per 1,000 fires is lower.Casualties per 1,000 incidents in Amherst, NY compared to nearest cities:
(Note: Based on data for all years, including only cities with at least 500 fire incidents)
| Amherst: | 6.6 |
| Williamsville: | 3.3 |
| Cheektowaga: | 9.8 |
| Kenmore: | 35.6 |
| Tonawanda: | 20.9 |
| North Tonawanda: | 7.9 |
| Depew: | 8.9 |
| Buffalo: | 5.5 |
| Lancaster: | 14.3 |
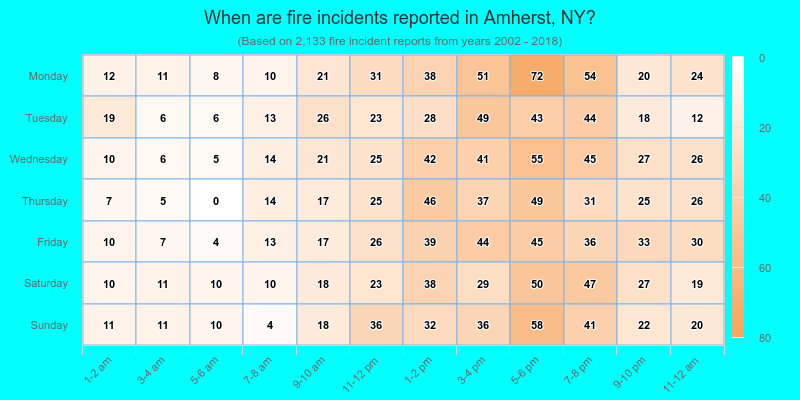
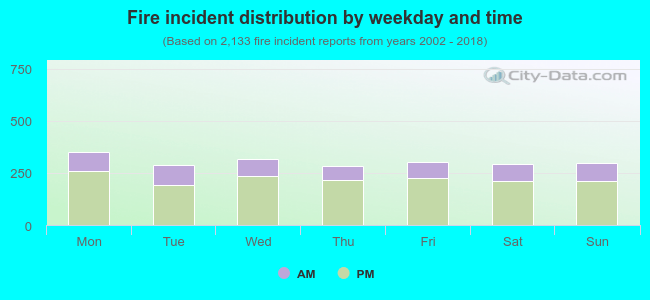 27.4% incidents where reported in the morning and 72.6% in the evening. The most fires (16.5%) took place on Monday, and the least (13.2%) on Thursday.
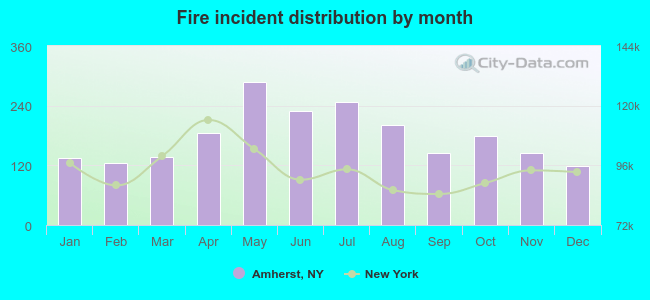 Based on the 2,133 incident reports from years 2002 - 2018 most fires (13.5%) took place during May, and the least (5.6%) in December.
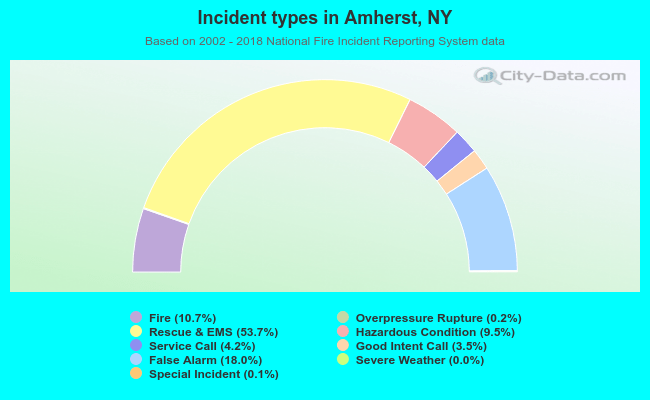 Out of all 19,914 cases reported during the years 2002 - 2018, the most belonged to the categories: Rescue & EMS (53.7%), False Alarm (18.0%), and Fire (10.7%).
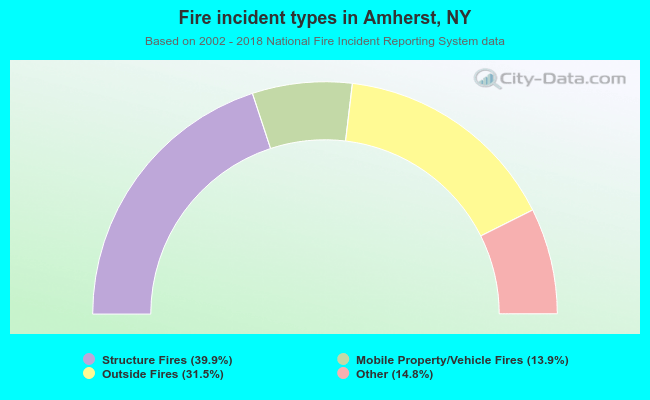 When looking into fire subcategories, the most incidents belonged to: Structure Fires (39.9%), and Outside Fires (31.5%).