| Fire incidents reported |
|---|
| Sreet name | Count |
|---|
| ST ROUTE 417 | 28 | | EAST VALLEY RD | 14 | | EAST VALLEY ROAD | 10 | | MAIN STREET | 10 | | STATE ROUTE 21 | 10 | | DYKE STREET | 8 | | ELM STREET | 8 | | RAY HILL RD | 8 | | STATE RT 417 | 8 | | CHESTNUT | 6 | | COUNTY ROAD 12 | 6 | | COUNTY RTE. 12 | 6 | | EAST GREENWOOD STREET | 6 | | FIRST STREET | 6 | | NORTH MAIN STREET | 6 | | PIXLEY HILL RD | 6 | | RAY HILL ROAD | 6 | | STATE ROUTE 417 | 6 | | BAKER STREET | 4 | | COUNTY RD 12 | 4 | | COUNTY RTE 22 | 4 | | COUNTY RTE. 30 | 4 | | COUNTY RTE.21 | 4 | | EAST VALLEY | 4 | | FAIRVIEW AVE. | 4 |
| | | Fire incidents reported |
|---|
| Sreet name | Count |
|---|
| JONES RD | 4 | | 2658 COUNTY RD 22 | 2 | | 340 ST. RTE 417 | 2 | | 36 CHUSTNUT ST | 2 | | 417 EAST | 2 | | 417 EAST RT | 2 | | BAKER | 2 | | BAKER ROAD | 2 | | BARRET HILL ROAD | 2 | | BARRETT RD | 2 | | BARRETT ROAD | 2 | | BULLARD RD | 2 | | BULLARD ROAD | 2 | | CENTER ST | 2 | | CHURCH ST | 2 | | CHURCH ST | 2 | | CLARK RDS | 2 | | CLARK ROAD | 2 | | CO RT 22 ANDOVER RD | 2 | | CORNELIUS ROAD | 2 | | COUNTY ROAD 12 RD | 2 | | COUNTY ROAD 21 | 2 | | COUNTY ROAD 22 | 2 | | COUNTY ROUTE 12 RT | 2 | | |
|
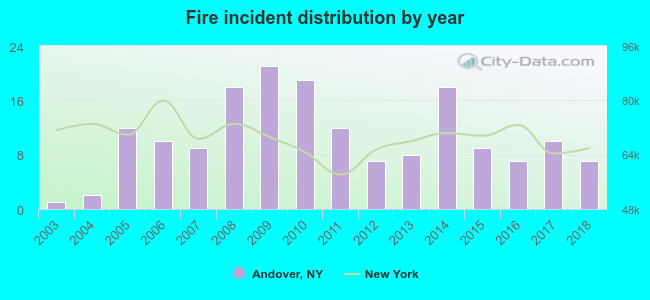 Based on the data from the years 2003 - 2018 the average number of fires per year is 11. The highest number of reported fire incidents - 21 took place in 2009, and the least - 1 in 2003. The data has a rising trend.
 27.6% incidents where reported in the morning and 72.4% in the evening. The most fires (18.8%) took place on Sunday, and the least (5.9%) on Tuesday.
 According to the 170 reports from years 2003 - 2018 most fires (12.4%) took place during July, and the least (4.1%) in September.
 Out of all 430 cases reported during the years 2003 - 2018, the most belonged to the categories: Fire (39.5%), Rescue & EMS (21.2%), and Overpressure Rupture (18.4%).
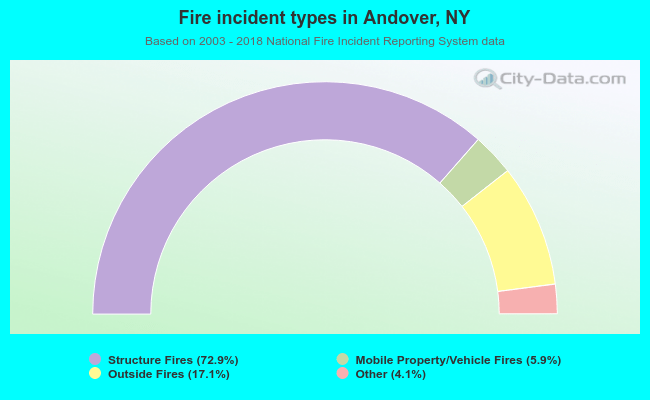 When looking into fire subcategories, the most incidents belonged to: Structure Fires (72.9%), and Outside Fires (17.1%).