Apalachin: Fire Incidents, New York (NY)
Where are fire incidents reported in Apalachin, NY
Something went wrong! Please refresh the page.
|
| |||||||||||||||||||||||||||||||||||||||||||||||||||||||||||||||||||||||||||||||||||||||||||||||||||||||||||||
2002 - 2018 National Fire Incident Reporting System (NFIRS) incidents
- Incident types reported to NFIRS in Apalachin, NY
- 1,49658.2%Rescue & EMS
- 36114.0%Fire
- 34813.5%Hazardous Condition
- 1154.5%Service Call
- 1134.4%False Alarm
- 1104.3%Good Intent Call
- 180.7%Severe Weather
- 60.2%Special Incident
- 30.1%Overpressure Rupture
- Fire incident types reported to NFIRS in Apalachin, NY
- 13738.0%Structure Fires
- 13036.0%Outside Fires
- 8022.2%Mobile Property/Vehicle Fires
- 143.9%Other
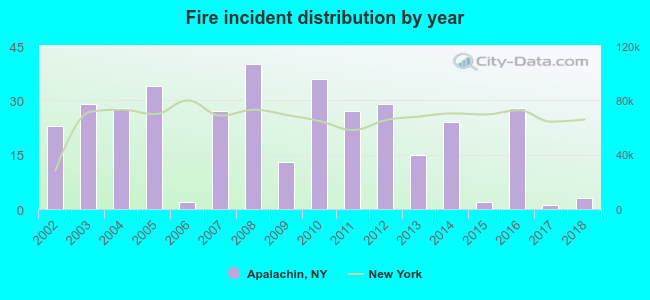 Based on the data from the years 2002 - 2018 the average number of fires per year is 21. The highest number of reported fire incidents - 40 took place in 2008, and the least - 1 in 2017. The data has a declining trend.
 According to the reports from the years 2002 - 2018 the average number of fire-related casualties per year is 0. The highest number of injuries - 2 took place in 2007, and the lowest - 0 in 2002. The data has a constant trend.
 27.7% incidents where reported in the morning and 72.3% in the evening. The most fires (19.1%) took place on Thursday, and the least (11.4%) on Friday.
 Based on the 361 reports from years 2002 - 2018 most fires (16.1%) took place during April, and the least (4.4%) in August.
 Out of all 2,570 cases reported during the years 2002 - 2018, the most belonged to the categories: Rescue & EMS (58.2%), Fire (14.0%), and Hazardous Condition (13.5%).
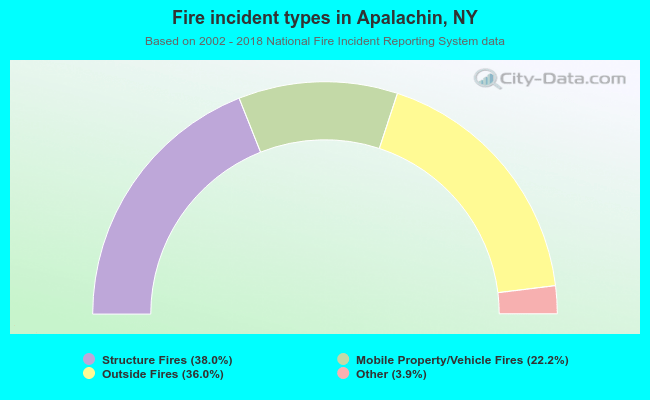 When looking into fire subcategories, the most incidents belonged to: Structure Fires (38.0%), and Outside Fires (36.0%).