Apple Springs: Fire Incidents, Texas (TX)
Where are fire incidents reported in Apple Springs, TX
Something went wrong! Please refresh the page.
|
| |||||||||||||||||||||||||||||||||||||||||||||||||||||||||||||||||||||||||||||||||||||||||||||||||||||||||||||
2008 - 2018 National Fire Incident Reporting System (NFIRS) incidents
- Incident types reported to NFIRS in Apple Springs, TX
- 10050.8%Fire
- 5125.9%Hazardous Condition
- 2613.2%Rescue & EMS
- 136.6%Good Intent Call
- 42.0%Severe Weather
- 21.0%Service Call
- 10.5%False Alarm
- Fire incident types reported to NFIRS in Apple Springs, TX
- 6060.0%Outside Fires
- 1919.0%Mobile Property/Vehicle Fires
- 1515.0%Structure Fires
- 66.0%Other
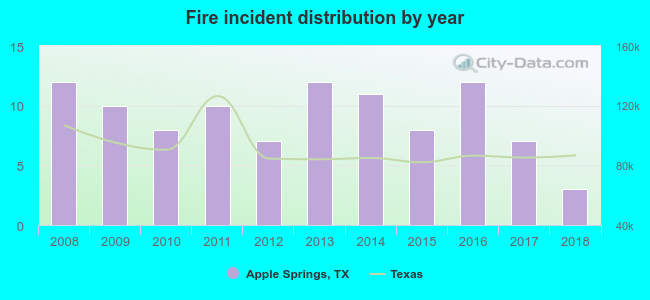 According to the data from the years 2008 - 2018 the average number of fire incidents per year is 9. The highest number of fires - 12 took place in 2008, and the least - 3 in 2018. The data has a declining trend.
 23.0% incidents where reported in the morning and 77.0% in the evening. The most fires (18.0%) took place on Monday, and the least (10.0%) on Friday.
 Based on the 100 reports from years 2008 - 2018 most fires (14.0%) took place during January, and the least (3.0%) in May.
 Out of all 197 cases reported during the years 2008 - 2018, the most belonged to the categories: Fire (50.8%), Rescue & EMS (25.9%), and Overpressure Rupture (13.2%).
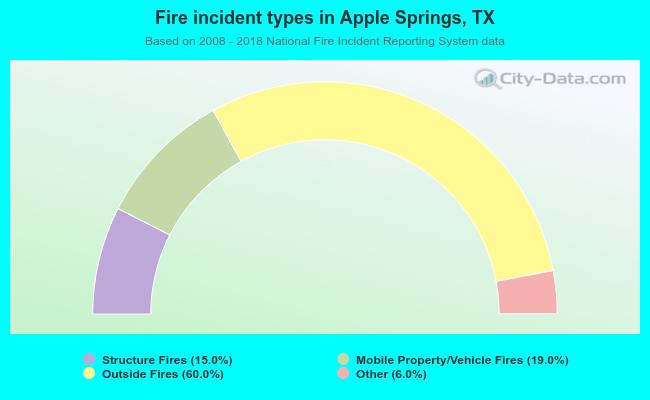 When looking into fire subcategories, the most reports belonged to: Outside Fires (60.0%), and Mobile Property/Vehicle Fires (19.0%).