Arcade: Fire Incidents, New York (NY)
Where are fire incidents reported in Arcade, NY
Something went wrong! Please refresh the page.
|
| |||||||||||||||||||||||||||||||||||||||||||||||||||||||||||||||||||||||||||||||||||||||||||||||||||||||||||||
2002 - 2018 National Fire Incident Reporting System (NFIRS) incidents
- Incident types reported to NFIRS in Arcade, NY
- 56152.4%Rescue & EMS
- 27025.2%Fire
- 928.6%Good Intent Call
- 888.2%Hazardous Condition
- 343.2%False Alarm
- 242.2%Service Call
- 20.2%Special Incident
- Fire incident types reported to NFIRS in Arcade, NY
- 13550.0%Structure Fires
- 7828.9%Outside Fires
- 3111.5%Mobile Property/Vehicle Fires
- 269.6%Other
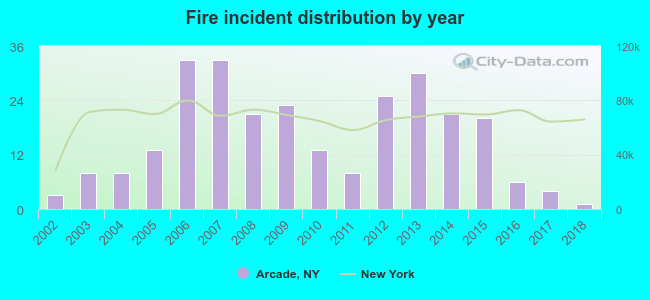 Based on the data from the years 2002 - 2018 the average number of fires per year is 16. The highest number of reported fire incidents - 33 took place in 2006, and the least - 1 in 2018. The data has a declining trend.
 35.2% incidents where reported in the morning and 64.8% in the evening. The most fires (18.1%) took place on Wednesday, and the least (9.3%) on Friday.
 According to the 270 reports from years 2002 - 2018 most fires (13.7%) took place during April, and the least (4.8%) in November.
 Out of all 1,071 cases reported during the years 2002 - 2018, the most belonged to the categories: Overpressure Rupture (52.4%), Fire (25.2%), and Service Call (8.6%).
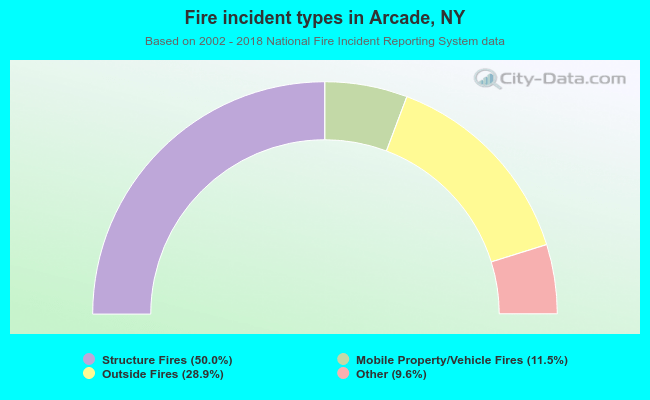 When looking into fire subcategories, the most incidents belonged to: Structure Fires (50.0%), and Outside Fires (28.9%).