| Fire incidents reported |
|---|
| Sreet name | Count |
|---|
| HIGHWAY 151 | 62 | | INTERSTATE20 | 38 | | GIRL SCOUT RD | 32 | | HIGHWAY 9 | 20 | | INTERSTATE 20 | 18 | | HWY 80 | 16 | | HIGHWAY 80 | 14 | | INTERSTATE 20 EASTBOUND | 14 | | COUNTY LINE ROAD | 12 | | HIGHWAY 147 | 12 | | HWY 9 | 12 | | INTERSTATE 20 WESTBOUND | 12 | | REESE RD | 12 | | HIGHWAY 544 | 10 | | HOLSTEAD RD | 10 | | SAMPSON RD | 10 | | SHARP RD | 10 | | BEECH ST | 8 | | CRAWFORD RD | 8 | | CRAWFORD ROAD | 8 | | HAZEL ST | 8 | | HIGHWAY 146 | 8 | | OAKLEY ROAD | 8 | | SALINE RIDGE ROAD | 8 | | 2ND ST | 6 |
| | | Fire incidents reported |
|---|
| Sreet name | Count |
|---|
| BACK FORTY ROAD | 6 | | CRAWFORD ST | 6 | | FIELDS RD | 6 | | GAP FARMS RD | 6 | | HIGHWAY 545 | 6 | | HWY 147 | 6 | | HWY 507 | 6 | | MILE MARKER 54 | 6 | | SMITH ST | 6 | | STATE ST | 6 | | WASHINGTON ST | 6 | | ALLEN RD | 4 | | CABLE ST | 4 | | CARNATION RD | 4 | | CHERRY ST | 4 | | CHOCLATE FACTORY RD | 4 | | COLLINGSWORTH ROAD | 4 | | DANIEL ST | 4 | | EAVES RD | 4 | | ELM ST | 4 | | HAMPTON RD | 4 | | HARMONY CHURCH RD | 4 | | HAZEL STREET | 4 | | INTERSTATE 20 WESTBOUND HWY | 4 | | |
|
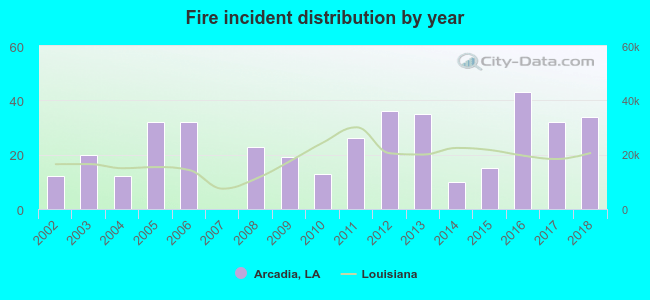 According to the data from the years 2002 - 2018 the average number of fire incidents per year is 23. The highest number of fires - 43 took place in 2016, and the least - 0 in 2007. The data has a rising trend.
 26.6% incidents where reported in the morning and 73.4% in the evening. The most fires (17.3%) took place on Thursday, and the least (10.9%) on Saturday.
 Based on the 394 fire incidents from years 2002 - 2018 most fires (14.5%) took place during March, and the least (4.3%) in November.
 Out of all 599 cases reported during the years 2002 - 2018, the most belonged to the categories: Fire (65.8%), False Alarm (13.5%), and Good Intent Call (9.7%).
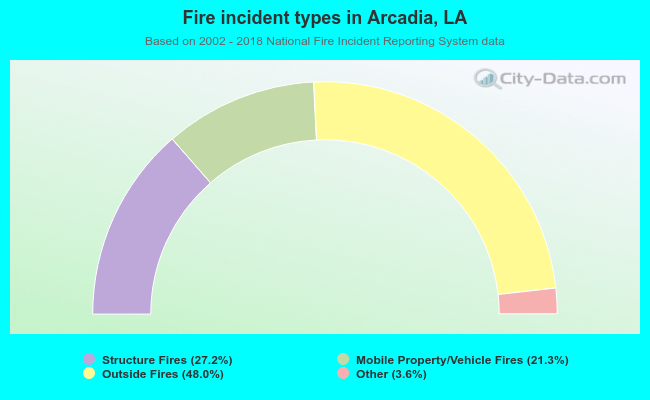 When looking into fire subcategories, the most reports belonged to: Outside Fires (48.0%), and Structure Fires (27.2%).