Arcola: Fire Incidents, Texas (TX)
Where are fire incidents reported in Arcola, TX
Something went wrong! Please refresh the page.
|
| |||||||||||||||||||||||||||||||||||||||||||||||||||||||||||||||||||||||||||||||||||||||||||||||||||||||||||||
2002 - 2018 National Fire Incident Reporting System (NFIRS) incidents
- Incident types reported to NFIRS in Arcola, TX
- 18535.9%Rescue & EMS
- 14628.3%Fire
- 9718.8%Hazardous Condition
- 468.9%Good Intent Call
- 224.3%False Alarm
- 193.7%Service Call
- 10.2%Overpressure Rupture
- Fire incident types reported to NFIRS in Arcola, TX
- 8356.8%Outside Fires
- 4933.6%Structure Fires
- 138.9%Mobile Property/Vehicle Fires
- 10.7%Other
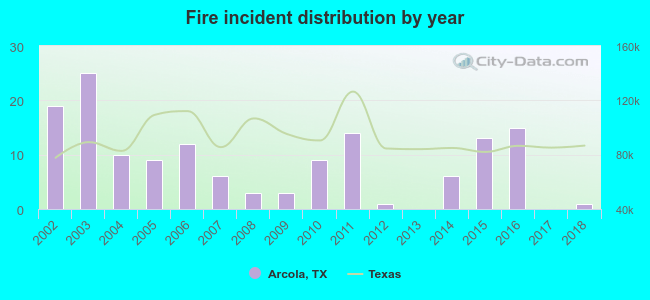 According to the data from the years 2002 - 2018 the average number of fires per year is 9. The highest number of reported fire incidents - 25 took place in 2003, and the least - 0 in 2013. The data has a dropping trend.
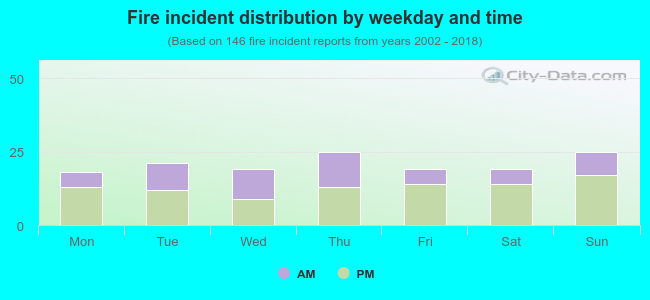 37.0% incidents where reported in the morning and 63.0% in the evening. The most fires (17.1%) took place on Thursday, and the least (12.3%) on Monday.
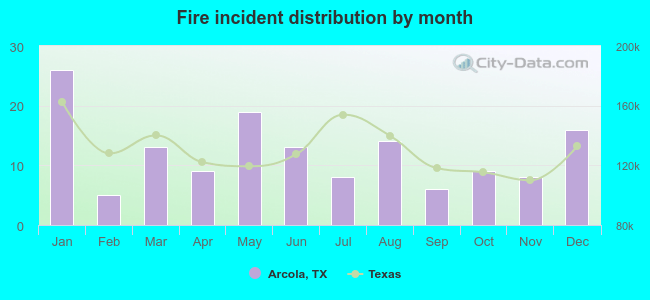 According to the 146 fires from years 2002 - 2018 most fires (17.8%) took place during January, and the least (3.4%) in February.
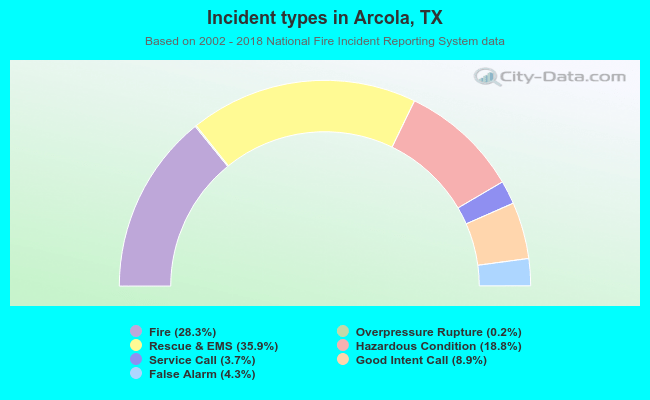 Out of all 516 cases reported during the years 2002 - 2018, the most belonged to the categories: Rescue & EMS (35.9%), Fire (28.3%), and Hazardous Condition (18.8%).
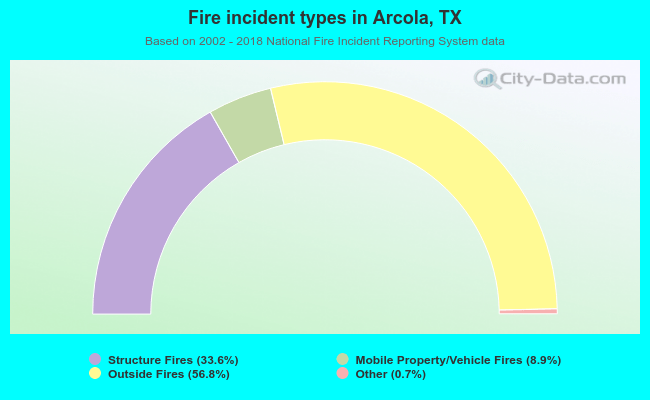 When looking into fire subcategories, the most reports belonged to: Outside Fires (56.8%), and Structure Fires (33.6%).