| Fire incidents reported |
|---|
| Sreet name | Count |
|---|
| I-65 | 14 | | MINNIE BROWN RD | 12 | | STATELINE ROAD | 10 | | MAIN STREET | 8 | | MEETING HOUSE RD | 8 | | ARDMORE HWY | 6 | | ARDMORE HWY | 6 | | BAUGH RD | 6 | | CHEATHAM RD | 6 | | GOWAN RD | 6 | | INTERSTATE 65 | 6 | | KELLY CREEK RD | 6 | | 7TH STREET | 4 | | AL HWY 53 | 4 | | ARDMORE RIDGE RD | 4 | | ARDMORE RIDGE ROAD | 4 | | AUSTIN WHITT RD | 4 | | COGGINS RD | 4 | | ELK ST | 4 | | GATLIN RD | 4 | | GRADY LANE | 4 | | HENRY BAYLESS RD | 4 | | MINNIE BROWN ROAD | 4 | | MOORESVILLE RD | 4 | | OLD BAPTIST RD | 4 |
| | | Fire incidents reported |
|---|
| Sreet name | Count |
|---|
| PHILPOT RD | 4 | | PLEASANT HILL ROAD | 4 | | PULASKI PIKE | 4 | | SLAUGHTER PEN ROAD | 4 | | 120 MINNIE BROWN ROAD | 2 | | 1333 LAKE LOGAN RD | 2 | | 1576 PLEASANT HILL RD | 2 | | 166 LAKE LOGAN | 2 | | 1892 PLEASANT HILL RD | 2 | | 195 PRICE ROAD | 2 | | 1ST ST | 2 | | 1ST STREET | 2 | | 23100 AUSTIN WHITT RD | 2 | | 26550 4TH ST | 2 | | 26865 SECONDSTREET | 2 | | 29125 VALLEY LN | 2 | | 2ND ST ARDMORE | 2 | | 31 SOUTH | 2 | | 31101 VALLEY LANE | 2 | | 31205 MITCHELL STREET | 2 | | 31255 ARDMORE RIDGE ROAD | 2 | | 3134 ARDMORE RIDGE RD. | 2 | | 315 STEVENSON RD | 2 | | 3211 BAUGH ROAD | 2 | | |
|
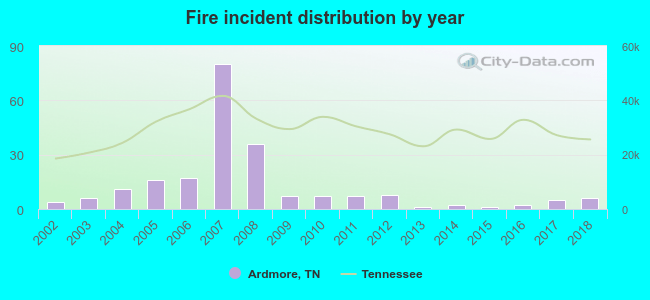 Based on the data from the years 2002 - 2018 the average number of fires per year is 13. The highest number of fire incidents - 80 took place in 2007, and the least - 1 in 2013. The data has a growing trend.
 32.9% incidents where reported in the morning and 67.1% in the evening. The most fires (19.9%) took place on Saturday, and the least (10.6%) on Tuesday.
 According to the 216 fires from years 2002 - 2018 most fires (12.0%) took place during February, and the least (5.1%) in October.
 Out of all 294 cases reported during the years 2002 - 2018, the most belonged to the categories: Fire (73.5%), Overpressure Rupture (10.2%), and Rescue & EMS (9.2%).
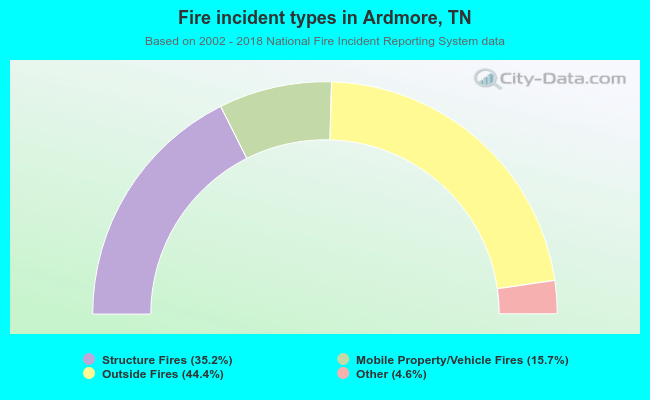 When looking into fire subcategories, the most reports belonged to: Outside Fires (44.4%), and Structure Fires (35.2%).