| Fire incidents reported |
|---|
| Sreet name | Count |
|---|
| EVERSON ROAD | 8 | | HWY 81 | 8 | | APPLE BRANCH ROAD | 6 | | BIGGS RD | 6 | | COUNTY HWY J | 6 | | STATE HWY 81 | 6 | | 13819 HWY 78 | 4 | | BROAD STREET | 4 | | COUNTY C | 4 | | COUNTY ROAD J | 4 | | EVERSON RD | 4 | | EVERSON RD | 4 | | FAYMONT ROAD | 4 | | HIGHWAY 81 HWY | 4 | | JORDAN CENTER RD | 4 | | JORDAN CENTER ROAD | 4 | | MEADOWBROOK ROAD RD | 4 | | MILWAUKEE STREET | 4 | | NOT AVAILABLE | 4 | | PRAIRIE VIEW | 4 | | PUDDLEDOCK RD | 4 | | RAT HOLLOW RD | 4 | | SPORE RD | 4 | | STATE HIGHWAY 81 | 4 | | STH 81 | 4 |
| | | Fire incidents reported |
|---|
| Sreet name | Count |
|---|
| TROTTER ROAD | 4 | | WHITESIDE RD | 4 | | WILDLIFE RD | 4 | | WILDLIFE ROAD | 4 | | 1603 CO Y | 2 | | 1603 HWY Y | 2 | | 1693 SAWMILL RD | 2 | | 17001 JACOBSON LANE | 2 | | 1814 THOR LANE | 2 | | 1885 CO Y | 2 | | 2572 CO Y | 2 | | 5144 COUNTY N RD | 2 | | 6484 HWY 81 | 2 | | 7936 CO HWY M | 2 | | 9179 RAT HOLLOW ROAD RD | 2 | | 9914 CO M | 2 | | APPLE BRANCH RD | 2 | | APPLE BRANCH ROAD RD | 2 | | APPLE GROVE CHURCH ROAD RD | 2 | | APPLEGROVE CHURCH RD | 2 | | APPPLE GROVE ROAD | 2 | | BIGGS RD | 2 | | BLACKHAWK MEMORIAL PARK | 2 | | BLUFF VIEW COURT | 2 | | BRENNAN ROAD | 2 |
|
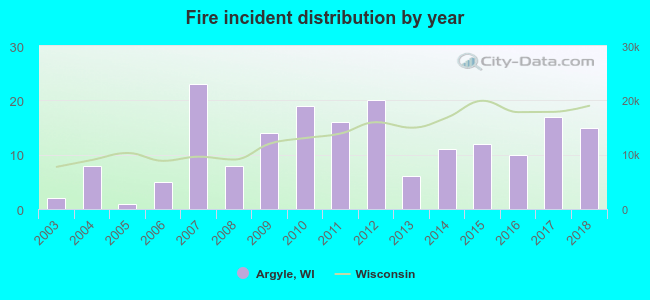 Based on the data from the years 2003 - 2018 the average number of fire incidents per year is 12. The highest number of reported fires - 23 took place in 2007, and the least - 1 in 2005. The data has a rising trend.
 28.3% incidents where reported in the morning and 71.7% in the evening. The most fires (20.3%) took place on Friday, and the least (10.2%) on Wednesday.
 According to the 187 fire incidents from years 2003 - 2018 most fires (17.1%) took place during March, and the least (3.2%) in July.
 Out of all 310 cases reported during the years 2003 - 2018, the most belonged to the categories: Fire (60.3%), Rescue & EMS (18.7%), and Overpressure Rupture (14.8%).
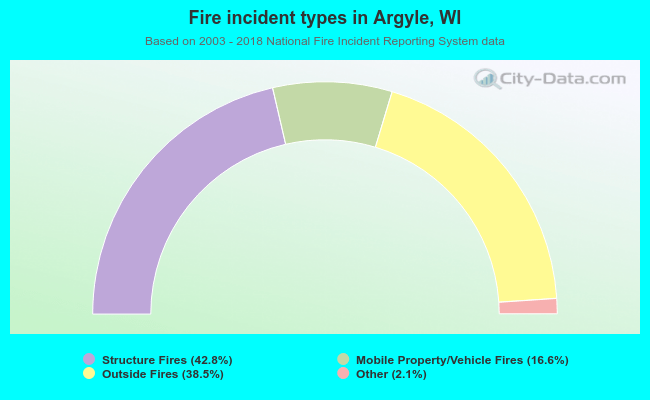 When looking into fire subcategories, the most reports belonged to: Structure Fires (42.8%), and Outside Fires (38.5%).