Arlington: Fire Incidents, Massachusetts (MA)
Where are fire incidents reported in Arlington, MA
Something went wrong! Please refresh the page.
| Fire incidents reported | |
|---|---|
| Sreet name | Count |
| MASS AVE | 300 |
| BROADWAY | 70 |
| SUMMER ST | 58 |
| MYSTIC ST | 44 |
| OLD COLONY LA | 40 |
| MILL ST | 38 |
| LAKE ST | 36 |
| GROVE ST | 34 |
| MASSAVE | 28 |
| WASHINGTON ST | 28 |
| COLUMBIA RD | 26 |
| GARDNER ST | 26 |
| APPLETON ST | 24 |
| PARK AVE | 24 |
| PLEASANT ST | 24 |
| DRAKE RD | 22 |
| MASS AVE AVE | 22 |
| SUNNYSIDE AVE | 22 |
| CONCORD TNPK | 20 |
| MAPLE ST | 20 |
| MARATHON ST | 20 |
| MEDFORD ST | 18 |
| RIDGE ST | 18 |
| GRAY ST | 16 |
| HILLSIDE AVE | 16 |
| JASON ST | 16 |
| MASSAVE AVE | 16 |
| NORTH UNION ST | 16 |
| WINSLOW ST | 16 |
| COLONIAL VILLAGE DR | 14 |
| Other | 545 |
2002 - 2018 National Fire Incident Reporting System (NFIRS) incidents
- Incident types reported to NFIRS in Arlington, MA
- 15,65951.3%Rescue & EMS
- 6,10220.0%Hazardous Condition
- 3,60711.8%False Alarm
- 2,3957.8%Service Call
- 1,6175.3%Fire
- 9813.2%Good Intent Call
- 800.3%Special Incident
- 710.2%Severe Weather
- Fire incident types reported to NFIRS in Arlington, MA
- 84452.2%Structure Fires
- 51031.5%Outside Fires
- 1459.0%Mobile Property/Vehicle Fires
- 1187.3%Other
 According to the data from the years 2002 - 2018 the average number of fire incidents per year is 95. The highest number of reported fire incidents - 132 took place in 2012, and the least - 55 in 2002. The data has an increasing trend.
The average number of yearly fire incidents per 10k residents in Arlington, MA compared to nearest cities:
(Note: Based on data for the last 3 years, including only cities with population 5,000 and above)
| Arlington: | 23.8 |
| Belmont: | 42.3 |
| Winchester: | 12.9 |
| Medford: | 41.3 |
| Watertown: | 12.2 |
| Lexington: | 11.5 |
| Somerville: | 56.2 |
| Cambridge: | 99.2 |
| Waltham: | 31.2 |
 The median response time based on all reported fire incidents is 3 minutes. This is lower than the state median value.
The median response time in Arlington, MA compared to nearest cities:
(Note: Based on data for all years, including only cities with at least 500 fire incidents)
| Arlington: | 3 minutes |
| Belmont: | 4 minutes |
| Winchester: | 4 minutes |
| Medford: | 3 minutes |
| Watertown: | 4 minutes |
| Lexington: | 5 minutes |
| Somerville: | 3 minutes |
| Cambridge: | 5 minutes |
| Waltham: | 4 minutes |
 According to the data from the years 2002 - 2018 the average number of fire-related yearly deaths is 0. The highest number of reported deaths - 1 took place in 2007, and the lowest - 0 in 2002. The data has a rising trend.
 Based on the reports from the years 2002 - 2018 the average number of fire-related yearly casualties is 1. The highest number of reported injuries - 4 took place in 2015, and the lowest - 0 in 2002. The data has a constant trend.
The average number of injuries per 1,000 fire incidents is 8. This indicator was the highest - 35 in 2015, and the lowest 0 in 2002. The trend for injuries per 1,000 fire incidents is constant. Compared to the state value the number of injuries per 1,000 fires is lower.
Based on the reports from the years 2002 - 2018 the average number of fire-related yearly casualties is 1. The highest number of reported injuries - 4 took place in 2015, and the lowest - 0 in 2002. The data has a constant trend.
The average number of injuries per 1,000 fire incidents is 8. This indicator was the highest - 35 in 2015, and the lowest 0 in 2002. The trend for injuries per 1,000 fire incidents is constant. Compared to the state value the number of injuries per 1,000 fires is lower.Casualties per 1,000 incidents in Arlington, MA compared to nearest cities:
(Note: Based on data for all years, including only cities with at least 500 fire incidents)
| Arlington: | 8.0 |
| Belmont: | 5.9 |
| Winchester: | 24.3 |
| Medford: | 8.0 |
| Watertown: | 12.2 |
| Lexington: | 22.2 |
| Somerville: | 16.3 |
| Cambridge: | 4.7 |
| Waltham: | 18.0 |
 28.8% incidents where reported in the morning and 71.2% in the evening. The most fires (16.6%) took place on Sunday, and the least (13.2%) on Monday.
 Based on the 1,617 incident reports from years 2002 - 2018 most fires (10.5%) took place during April, and the least (6.2%) in December.
 Out of all 30,529 cases reported during the years 2002 - 2018, the most belonged to the categories: Rescue & EMS (51.3%), Hazardous Condition (20.0%), and False Alarm (11.8%).
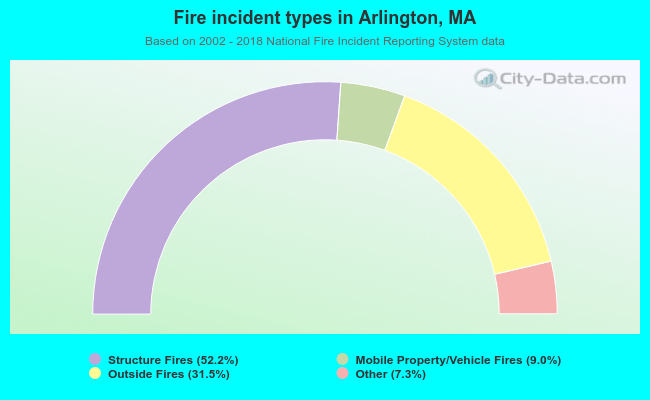 When looking into fire subcategories, the most reports belonged to: Structure Fires (52.2%), and Outside Fires (31.5%).