Armada: Fire Incidents, Michigan (MI)
Where are fire incidents reported in Armada, MI
Something went wrong! Please refresh the page.
|
| |||||||||||||||||||||||||||||||||||||||||||||||||||||||||||||||||||||||||||||||||||||||||||||||||||||||||||||
2002 - 2018 National Fire Incident Reporting System (NFIRS) incidents
- Incident types reported to NFIRS in Armada, MI
- 2,34163.4%Rescue & EMS
- 45812.4%Hazardous Condition
- 3529.5%Fire
- 2747.4%Service Call
- 1233.3%Good Intent Call
- 1062.9%False Alarm
- 320.9%Special Incident
- 60.2%Severe Weather
- Fire incident types reported to NFIRS in Armada, MI
- 17950.9%Structure Fires
- 9727.6%Outside Fires
- 5615.9%Mobile Property/Vehicle Fires
- 205.7%Other
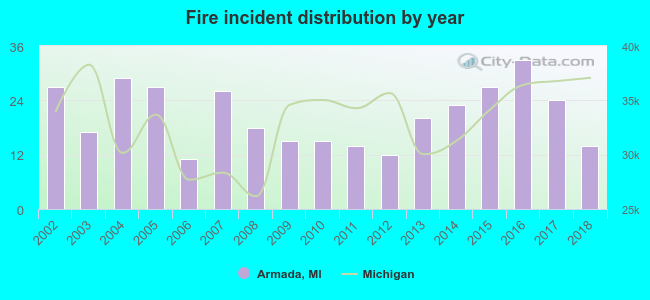 Based on the data from the years 2002 - 2018 the average number of fire incidents per year is 21. The highest number of reported fires - 33 took place in 2016, and the least - 11 in 2006. The data has a declining trend.
 28.7% incidents where reported in the morning and 71.3% in the evening. The most fires (20.2%) took place on Saturday, and the least (10.8%) on Thursday.
 According to the 352 fire incident reports from years 2002 - 2018 most fires (12.2%) took place during April, and the least (6.0%) in July.
 Out of all 3,694 cases reported during the years 2002 - 2018, the most belonged to the categories: Rescue & EMS (63.4%), Hazardous Condition (12.4%), and Fire (9.5%).
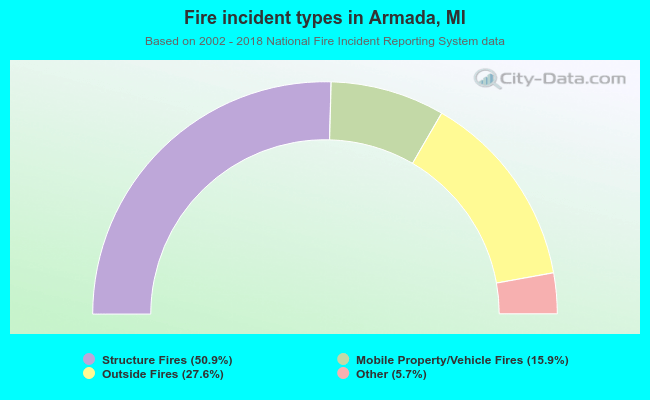 When looking into fire subcategories, the most reports belonged to: Structure Fires (50.9%), and Outside Fires (27.6%).