Armona: Fire Incidents, California (CA)
Where are fire incidents reported in Armona, CA
Something went wrong! Please refresh the page.
|
| |||||||||||||||||||||||||||||||||||||||||||||||||||||||||||||||||||||||||||||||||||||||||||||||||||||||||||||
2004 - 2018 National Fire Incident Reporting System (NFIRS) incidents
- Incident types reported to NFIRS in Armona, CA
- 95659.7%Rescue & EMS
- 25515.9%Fire
- 1328.2%Good Intent Call
- 1197.4%Service Call
- 915.7%Hazardous Condition
- 472.9%False Alarm
- 20.1%Overpressure Rupture
- Fire incident types reported to NFIRS in Armona, CA
- 14356.1%Outside Fires
- 6625.9%Structure Fires
- 4116.1%Mobile Property/Vehicle Fires
- 52.0%Other
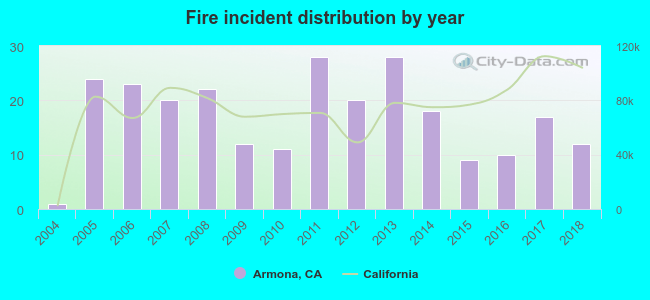 According to the data from the years 2004 - 2018 the average number of fire incidents per year is 17. The highest number of reported fires - 28 took place in 2011, and the least - 1 in 2004. The data has an increasing trend.
 29.8% incidents where reported in the morning and 70.2% in the evening. The most fires (17.3%) took place on Tuesday, and the least (10.2%) on Monday.
 Based on the 255 fire incidents from years 2004 - 2018 most fires (12.9%) took place during June, and the least (5.1%) in February.
 Out of all 1,602 cases reported during the years 2004 - 2018, the most belonged to the categories: Rescue & EMS (59.7%), Fire (15.9%), and Good Intent Call (8.2%).
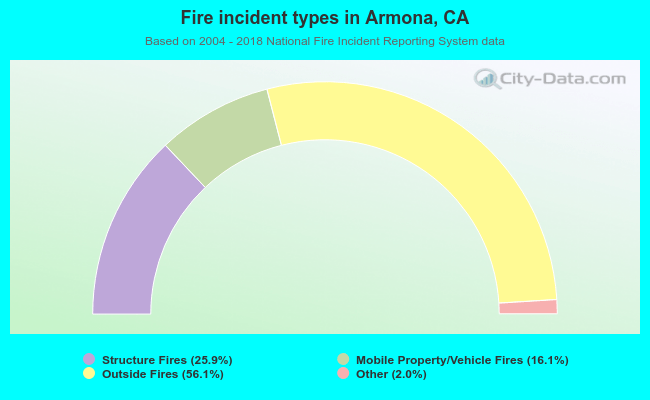 When looking into fire subcategories, the most reports belonged to: Outside Fires (56.1%), and Structure Fires (25.9%).