Arp: Fire Incidents, Texas (TX)
Where are fire incidents reported in Arp, TX
Something went wrong! Please refresh the page.
|
| |||||||||||||||||||||||||||||||||||||||||||||||||||||||||||||||||||||||||||||||||||||||||||||||||||||||||||||
2003 - 2018 National Fire Incident Reporting System (NFIRS) incidents
- Incident types reported to NFIRS in Arp, TX
- 73264.6%Fire
- 22219.6%Rescue & EMS
- 736.4%Hazardous Condition
- 585.1%Good Intent Call
- 262.3%Service Call
- 90.8%False Alarm
- 80.7%Severe Weather
- 50.4%Special Incident
- Fire incident types reported to NFIRS in Arp, TX
- 39754.2%Outside Fires
- 15821.6%Structure Fires
- 13418.3%Other
- 435.9%Mobile Property/Vehicle Fires
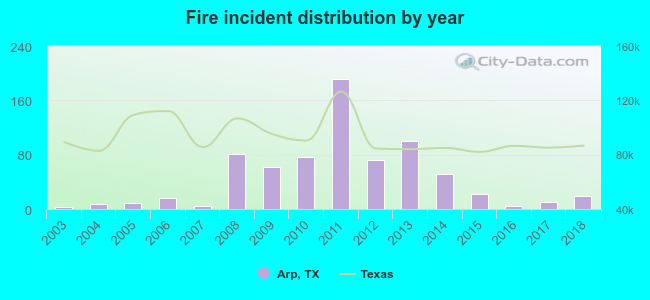 According to the data from the years 2003 - 2018 the average number of fires per year is 46. The highest number of fires - 192 took place in 2011, and the least - 3 in 2003. The data has a rising trend.
 The median response time based on all reported fire incidents is 8 minutes. This is higher compared to the Texas median value.
The median response time in Arp, TX compared to nearest cities:
(Note: Based on data for all years, including only cities with at least 500 fire incidents)
| Arp: | 8 minutes |
| Overton: | 6 minutes |
| Troup: | 10 minutes |
| Kilgore: | 8 minutes |
| Henderson: | 7 minutes |
| Tyler: | 6 minutes |
| Bullard: | 10 minutes |
| Winona: | 15 minutes |
| Jacksonville: | 6 minutes |
 24.0% incidents where reported in the morning and 76.0% in the evening. The most fires (15.4%) took place on Tuesday, and the least (13.0%) on Wednesday.
 According to the 732 fire incident reports from years 2003 - 2018 most fires (13.0%) took place during July, and the least (4.5%) in November.
 Out of all 1,133 cases reported during the years 2003 - 2018, the most belonged to the categories: Fire (64.6%), Overpressure Rupture (19.6%), and Rescue & EMS (6.4%).
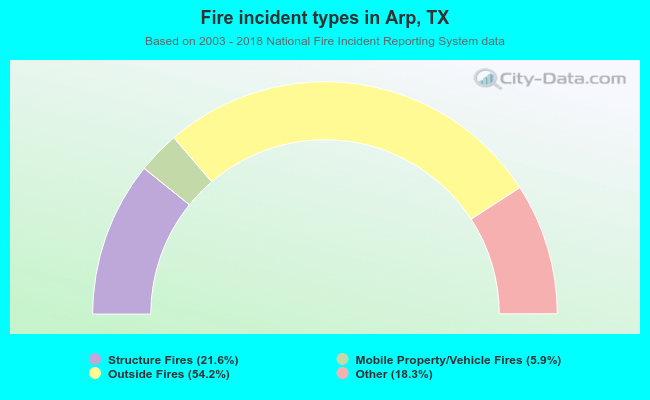 When looking into fire subcategories, the most incidents belonged to: Outside Fires (54.2%), and Structure Fires (21.6%).