Ashburn: Fire Incidents, Virginia (VA)
Where are fire incidents reported in Ashburn, VA
Something went wrong! Please refresh the page.
| Fire incidents reported | |
|---|---|
| Sreet name | Count |
| RUNNYMEADE TER | 126 |
| BELMONT RIDGE RD | 46 |
| WAXPOOL RD | 36 |
| ASHBURN SHOPPING PLZ | 34 |
| ASHBURN RD | 30 |
| BROADLANDS CENTER PLZ | 30 |
| HAY RD | 28 |
| DULLES GREENWAY | 26 |
| HARRY BYRD HWY | 26 |
| RYAN RD | 26 |
| BLOSSOM HILL TER | 24 |
| ASHBURN VILLAGE BLVD | 22 |
| DODGE TER | 22 |
| ARMSTRONG TER | 20 |
| CLAIBORNE PKY | 20 |
| GREENWAY CORPORATE DR | 20 |
| SMITH SWITCH RD | 20 |
| TIMBER RIDGE TER | 20 |
| APOLLO TER | 18 |
| COLTSFOOT TER | 18 |
| LOUDOUN COUNTY PKY | 18 |
| RIVER RIDGE TER | 18 |
| FARMWELL HUNT PLZ | 16 |
| ASHBURN SHOPPING PLAZA | 14 |
| CRESCENT PARK SQ | 14 |
| HYDE PARK DR | 14 |
| OMEARA TER | 14 |
| ORCHARD GRASS TER | 14 |
| RUNNYMEADE TRCE | 14 |
| SMITH CIR | 14 |
| Other | 1,255 |
2002 - 2018 National Fire Incident Reporting System (NFIRS) incidents
- Incident types reported to NFIRS in Ashburn, VA
- 8,13540.5%Rescue & EMS
- 3,23516.1%False Alarm
- 2,92914.6%Hazardous Condition
- 2,58612.9%Good Intent Call
- 2,01710.0%Fire
- 1,0685.3%Service Call
- 740.4%Special Incident
- 560.3%Overpressure Rupture
- Fire incident types reported to NFIRS in Ashburn, VA
- 1,10154.6%Structure Fires
- 62430.9%Outside Fires
- 1638.1%Mobile Property/Vehicle Fires
- 1296.4%Other
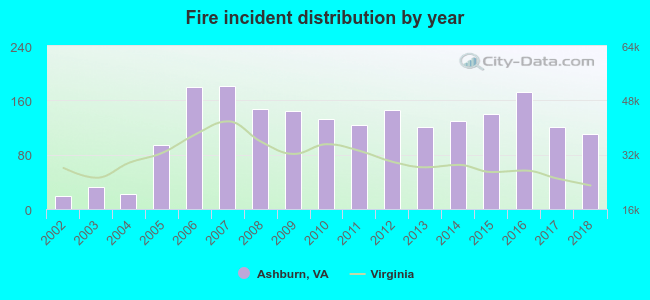 Based on the data from the years 2002 - 2018 the average number of fires per year is 119. The highest number of fires - 181 took place in 2007, and the least - 19 in 2002. The data has an increasing trend.
The average number of yearly fire incidents per 10k residents in Ashburn, VA compared to nearest cities:
(Note: Based on data for the last 3 years, including only cities with population 5,000 and above)
| Ashburn: | 31.0 |
| Lansdowne: | 0.9 |
| Sterling: | 37.0 |
| Leesburg: | 16.7 |
| Herndon: | 56.5 |
| South Riding: | 2.5 |
| Stone Ridge: | 1.4 |
| Reston: | 15.5 |
| Great Falls: | 20.1 |
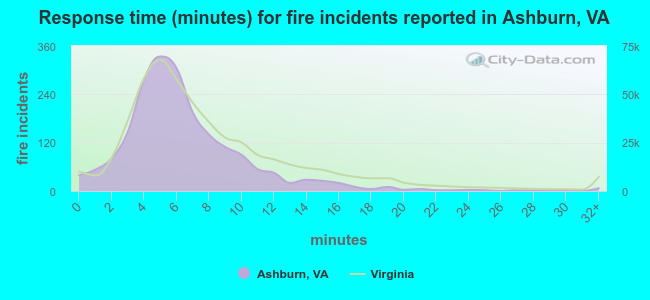 The median response time based on all reported fire incidents is 6 minutes. This is about the same as the Virginia median value.
The median response time in Ashburn, VA compared to nearest cities:
(Note: Based on data for all years, including only cities with at least 500 fire incidents)
| Ashburn: | 6 minutes |
| Sterling: | 6 minutes |
| Leesburg: | 7 minutes |
| Herndon: | 5 minutes |
| Reston: | 5 minutes |
| Chantilly: | 6 minutes |
| Purcellville: | 9 minutes |
| Centreville: | 6 minutes |
| Germantown: | 6 minutes |
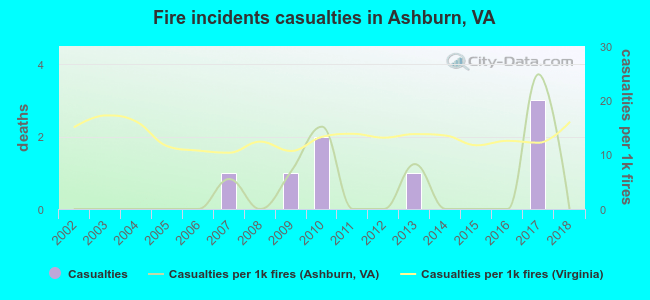 According to the data from the years 2002 - 2018 the average number of fire-related yearly casualties is 0. The highest number of reported casualties - 3 took place in 2017, and the lowest - 0 in 2002. The data has a constant trend.
The average number of injuries per 1,000 fire incidents is 4. This indicator was the highest - 25 in 2017, and the lowest 0 in 2002. The trend for casualties per 1,000 incidents is constant. Compared to the Virginia value the number of casualties per 1,000 fire incidents is much lower.
According to the data from the years 2002 - 2018 the average number of fire-related yearly casualties is 0. The highest number of reported casualties - 3 took place in 2017, and the lowest - 0 in 2002. The data has a constant trend.
The average number of injuries per 1,000 fire incidents is 4. This indicator was the highest - 25 in 2017, and the lowest 0 in 2002. The trend for casualties per 1,000 incidents is constant. Compared to the Virginia value the number of casualties per 1,000 fire incidents is much lower.Casualties per 1,000 incidents in Ashburn, VA compared to nearest cities:
(Note: Based on data for all years, including only cities with at least 500 fire incidents)
| Ashburn: | 4.0 |
| Sterling: | 13.4 |
| Leesburg: | 1.6 |
| Herndon: | 1.2 |
| Reston: | 1.1 |
| Chantilly: | 4.3 |
| Purcellville: | 0.9 |
| Centreville: | 0.0 |
| Germantown: | 22.2 |
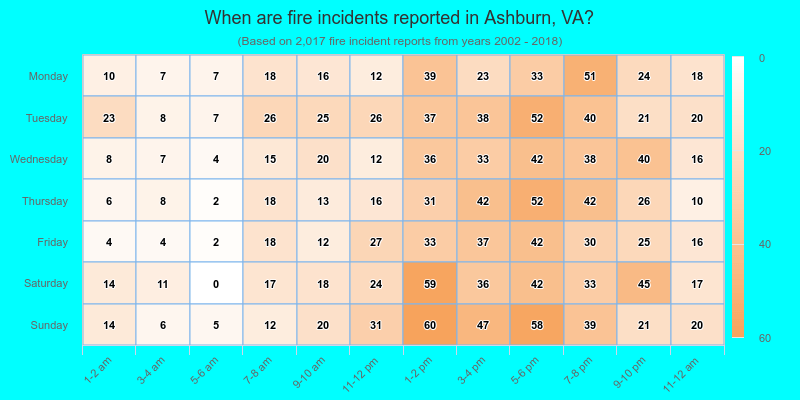
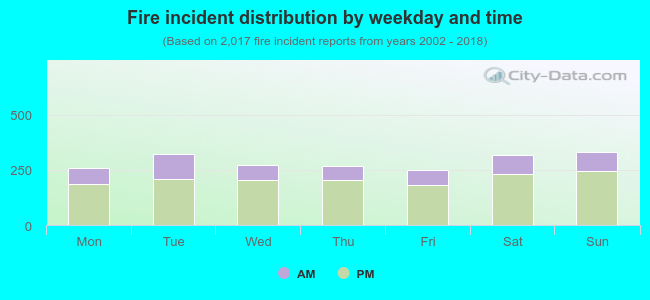 27.4% incidents where reported in the morning and 72.6% in the evening. The most fires (16.5%) took place on Sunday, and the least (12.4%) on Friday.
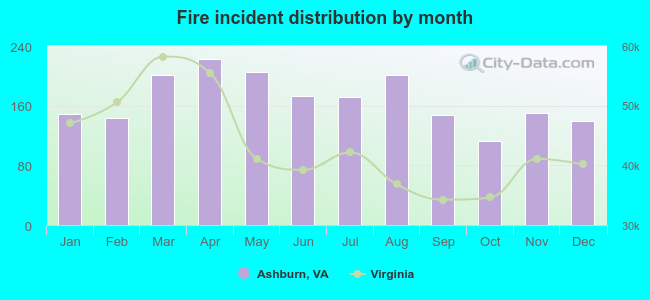 According to the 2,017 reports from years 2002 - 2018 most fires (11.0%) took place during April, and the least (5.6%) in October.
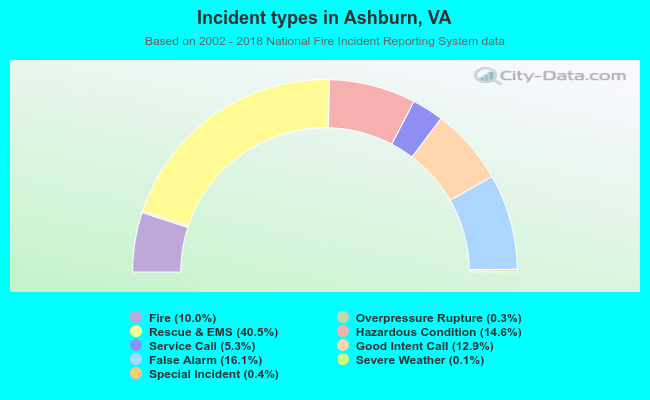 Out of all 20,111 cases reported during the years 2002 - 2018, the most belonged to the categories: Rescue & EMS (40.5%), False Alarm (16.1%), and Hazardous Condition (14.6%).
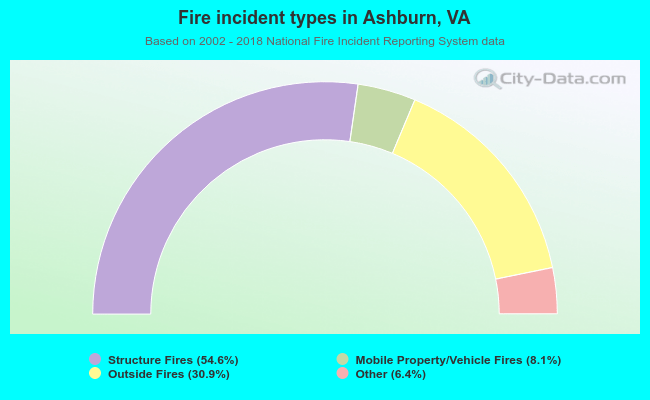 When looking into fire subcategories, the most incidents belonged to: Structure Fires (54.6%), and Outside Fires (30.9%).