| Fire incidents reported |
|---|
| Sreet name | Count |
|---|
| WALNUT ST | 22 | | BROAD (04) ST | 16 | | CENTER (38) ST | 16 | | CENTER ST | 16 | | WALNUT (38) ST | 12 | | OAKLAND (38) AVE | 10 | | CENTRE ST | 8 | | FOUNTAIN (04) ST | 8 | | FOUNTAIN ST | 8 | | BROCK (38) ST | 6 | | WALNUT STREET | 6 | | AIRPORT (04) RD | 4 | | CENTER ST | 4 | | CENTER STREET | 4 | | CENTRE STREET | 4 | | CHESTNUT (38) ST | 4 | | COUNTRY CLUB (04) RD | 4 | | FOUNTAIN STREET | 4 | | GERMANVILLE (04) RD | 4 | | HIGH (04) RD | 4 | | HINKEL01 RD | 4 | | HOFFMAN (38) BLVD | 4 | | HOFFMAN BLVD | 4 | | MALONES ROAD | 4 | | MARKET (38) ST | 4 |
| | | Fire incidents reported |
|---|
| Sreet name | Count |
|---|
| MEMORIAL (38) BLVD | 4 | | MIDDLE (38) ST | 4 | | NINETEENTH (38) ST | 4 | | 118 SOUTH INTERSTATE 81 | 2 | | 12 STREET | 2 | | 1237 ARCH STREET | 2 | | 13TH STREET | 2 | | 1831 WALNUT STREET | 2 | | 20 GUY ST | 2 | | 200 WALNUT STREET | 2 | | 2003 WALNUT ST | 2 | | 333 WALNUT ST | 2 | | 612 W CENTRE STREET | 2 | | 819 W CENTRE | 2 | | 9TH ST38PINE ST ST | 2 | | BEURY'S (01) RD | 2 | | BIDDLE (46) ST | 2 | | BIG MINE RUN (04) RD | 2 | | BIG MINE RUN RD | 2 | | BROCK STREET | 2 | | CATAWISSA (38) RD | 2 | | CEMTRE ST | 2 | | CENTER ST ST | 2 | | CENTER38 ST | 2 | | |
|
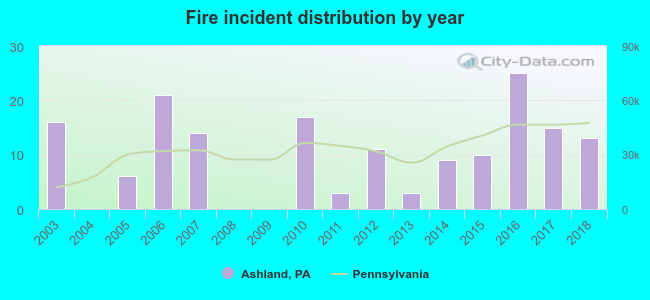 According to the data from the years 2003 - 2018 the average number of fires per year is 10. The highest number of reported fire incidents - 25 took place in 2016, and the least - 0 in 2004. The data has a decreasing trend.
 35.6% incidents where reported in the morning and 64.4% in the evening. The most fires (21.5%) took place on Friday, and the least (10.4%) on Monday.
 Based on the 163 fire incident reports from years 2003 - 2018 most fires (17.2%) took place during April, and the least (4.3%) in July.
 Out of all 428 cases reported during the years 2003 - 2018, the most belonged to the categories: Fire (38.1%), Rescue & EMS (22.7%), and Hazardous Condition (10.0%).
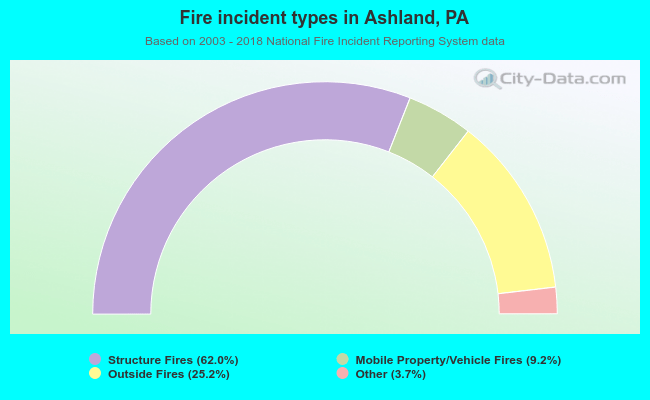 When looking into fire subcategories, the most reports belonged to: Structure Fires (62.0%), and Outside Fires (25.2%).