Aspen: Fire Incidents, Colorado (CO)
Where are fire incidents reported in Aspen, CO
Something went wrong! Please refresh the page.
|
| |||||||||||||||||||||||||||||||||||||||||||||||||||||||||||||||||||||||||||||||||||||||||||||||||||||||||||||
2003 - 2018 National Fire Incident Reporting System (NFIRS) incidents
- Incident types reported to NFIRS in Aspen, CO
- 3,11044.8%False Alarm
- 1,41220.4%Good Intent Call
- 1,06515.4%Hazardous Condition
- 4466.4%Special Incident
- 4276.2%Rescue & EMS
- 3064.4%Fire
- 1632.3%Service Call
- Fire incident types reported to NFIRS in Aspen, CO
- 13945.4%Structure Fires
- 12039.2%Outside Fires
- 3110.1%Mobile Property/Vehicle Fires
- 165.2%Other
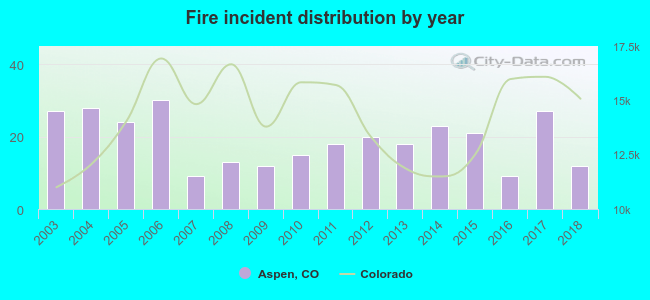 Based on the data from the years 2003 - 2018 the average number of fires per year is 19. The highest number of reported fires - 30 took place in 2006, and the least - 9 in 2007. The data has a declining trend.
The average number of yearly fire incidents per 10k residents in Aspen, CO compared to nearest cities:
(Note: Based on data for the last 3 years, including only cities with population 5,000 and above)
| Aspen: | 23.5 |
| Carbondale: | 44.6 |
| Eagle: | 29.9 |
| Gypsum: | 44.6 |
| Edwards: | 19.2 |
| Avon: | 27.4 |
| Glenwood Springs: | 27.4 |
| Vail: | 78.2 |
| Gunnison: | 17.9 |

 32.4% incidents where reported in the morning and 67.6% in the evening. The most fires (17.3%) took place on Friday, and the least (10.8%) on Tuesday.
 According to the 306 incident reports from years 2003 - 2018 most fires (13.1%) took place during July, and the least (5.6%) in March.
 Out of all 6,937 cases reported during the years 2003 - 2018, the most belonged to the categories: False Alarm (44.8%), Good Intent Call (20.4%), and Hazardous Condition (15.4%).
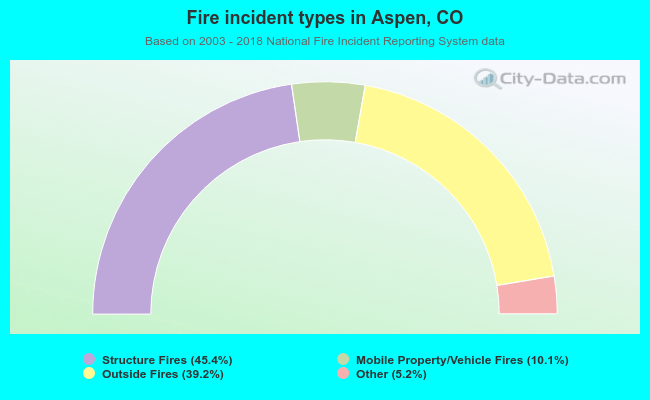 When looking into fire subcategories, the most reports belonged to: Structure Fires (45.4%), and Outside Fires (39.2%).