Atlanta: Fire Incidents, Indiana (IN)
Where are fire incidents reported in Atlanta, IN
Something went wrong! Please refresh the page.
|
| |||||||||||||||||||||||||||||||||||||||||||||||||||||||||||||||||||||||||||||||||||||||||||||||||||||||||||||
2002 - 2018 National Fire Incident Reporting System (NFIRS) incidents
- Incident types reported to NFIRS in Atlanta, IN
- 23135.4%Rescue & EMS
- 18828.8%Fire
- 9314.3%Good Intent Call
- 7311.2%Hazardous Condition
- 538.1%Service Call
- 142.1%False Alarm
- Fire incident types reported to NFIRS in Atlanta, IN
- 8746.3%Structure Fires
- 7137.8%Outside Fires
- 2312.2%Mobile Property/Vehicle Fires
- 73.7%Other
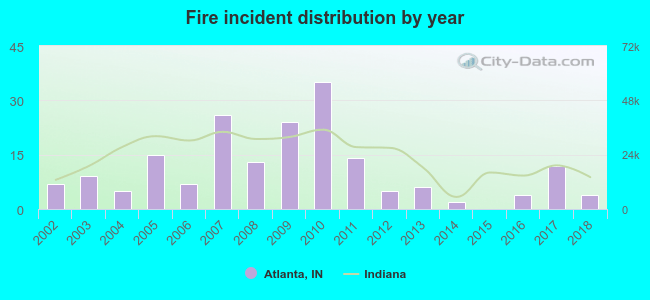 According to the data from the years 2002 - 2018 the average number of fires per year is 11. The highest number of reported fire incidents - 35 took place in 2010, and the least - 0 in 2015. The data has a decreasing trend.
 28.7% incidents where reported in the morning and 71.3% in the evening. The most fires (18.6%) took place on Wednesday, and the least (9.6%) on Sunday.
 Based on the 188 fire incidents from years 2002 - 2018 most fires (12.8%) took place during February, and the least (2.7%) in May.
 Out of all 652 cases reported during the years 2002 - 2018, the most belonged to the categories: Overpressure Rupture (35.4%), Fire (28.8%), and Service Call (14.3%).
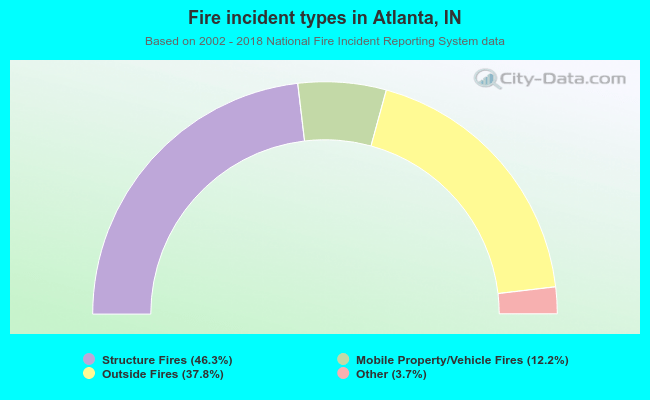 When looking into fire subcategories, the most reports belonged to: Structure Fires (46.3%), and Outside Fires (37.8%).