Atlantic City: Fire Incidents, New Jersey (NJ)
Where are fire incidents reported in Atlantic City, NJ
Something went wrong! Please refresh the page.
| Fire incidents reported | |
|---|---|
| Sreet name | Count |
| ATLANTIC AVE | 316 |
| BOARDWALK | 224 |
| VERMONT AVE | 222 |
| PACIFIC AVE | 202 |
| RHODE ISLAND AVE | 164 |
| VIRGINIA AVE | 164 |
| TENNESSEE AVE | 138 |
| ABSECON BLVD | 134 |
| ARCTIC AVE | 118 |
| NORTH CAROLINA AVE | 118 |
| ALBANY AVE | 100 |
| MARYLAND AVE | 100 |
| NEW YORK AVE | 100 |
| INDIANA AVE | 96 |
| NEW HAMPSHIRE AVE | 94 |
| BALTIC AVE | 92 |
| MICHIGAN AVE | 90 |
| MARTIN LUTHER KING BLVD | 88 |
| ATLANTIC AV | 84 |
| SOUTH CAROLINA AVE | 84 |
| PENNSYLVANIA AVE | 80 |
| ARKANSAS AVE | 78 |
| MISSOURI AVE | 76 |
| OHIO AVE | 66 |
| PACIFIC AV | 66 |
| 1900 BOARDWALK | 64 |
| FLORIDA AVE | 60 |
| KENTUCKY AVE | 60 |
| MEDITERRANEAN AVE | 56 |
| 2821 BOARDWALK | 52 |
| Other | 401 |
2004 - 2018 National Fire Incident Reporting System (NFIRS) incidents
- Incident types reported to NFIRS in Atlantic City, NJ
- 15,80351.4%Rescue & EMS
- 4,20113.7%Hazardous Condition
- 3,78712.3%Fire
- 3,31510.8%False Alarm
- 2,2827.4%Good Intent Call
- 1,1003.6%Service Call
- 2210.7%Special Incident
- 320.1%Overpressure Rupture
- Fire incident types reported to NFIRS in Atlantic City, NJ
- 1,93351.0%Structure Fires
- 1,12229.6%Outside Fires
- 42311.2%Other
- 3098.2%Mobile Property/Vehicle Fires
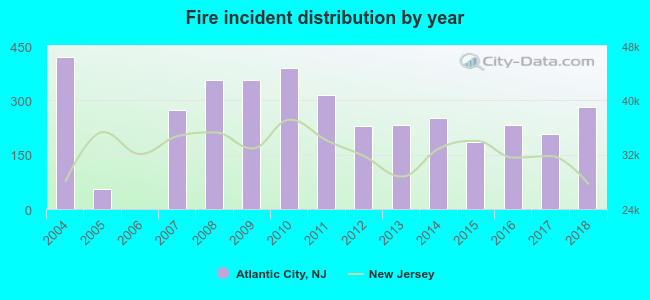 Based on the data from the years 2004 - 2018 the average number of fires per year is 252. The highest number of fires - 420 took place in 2004, and the least - 0 in 2006. The data has a decreasing trend.
The average number of yearly fire incidents per 10k residents in Atlantic City, NJ compared to nearest cities:
(Note: Based on data for the last 3 years, including only cities with population 5,000 and above)
| Atlantic City: | 61.0 |
| Brigantine: | 37.1 |
| Margate City: | 34.2 |
| Pleasantville: | 46.4 |
| Absecon: | 17.1 |
| Northfield: | 31.0 |
| Linwood: | 12.3 |
| Pomona: | 23.9 |
| Somers Point: | 43.1 |
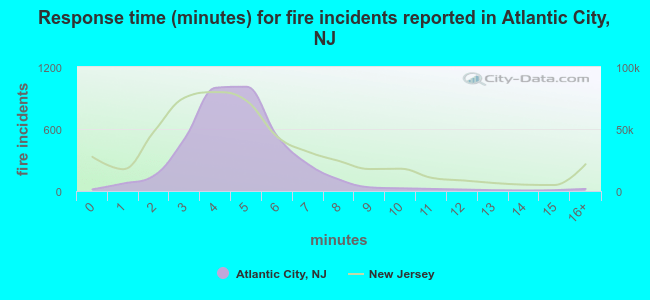 The median response time based on all reported fire incidents is 5 minutes. This is similar to the state median value.
The median response time in Atlantic City, NJ compared to nearest cities:
(Note: Based on data for all years, including only cities with at least 500 fire incidents)
| Atlantic City: | 5 minutes |
| Brigantine: | 3 minutes |
| Pleasantville: | 2 minutes |
| Somers Point: | 6 minutes |
| Ocean City: | 2 minutes |
| Mays Landing: | 6 minutes |
| Manahawkin: | 4 minutes |
| Hammonton: | 7 minutes |
| Cape May Court House: | 5 minutes |
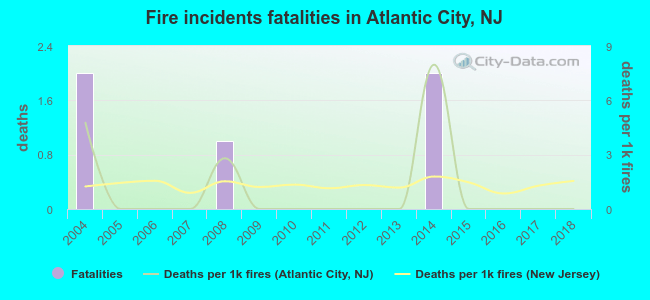 According to the reports from the years 2004 - 2018 the average number of fire-related fatalities per year is 0. The highest number of reported deaths - 2 took place in 2004, and the lowest - 0 in 2005. The data has a declining trend.
The average number of fatalities per 1,000 fires is 1. This indicator was the highest - 8 in 2014, and the lowest 0 in 2005. The trend for fatalities per 1,000 incidents is declining. Compared to the state value the number of deaths per 1,000 fires is similar.
According to the reports from the years 2004 - 2018 the average number of fire-related fatalities per year is 0. The highest number of reported deaths - 2 took place in 2004, and the lowest - 0 in 2005. The data has a declining trend.
The average number of fatalities per 1,000 fires is 1. This indicator was the highest - 8 in 2014, and the lowest 0 in 2005. The trend for fatalities per 1,000 incidents is declining. Compared to the state value the number of deaths per 1,000 fires is similar.Deaths per 1,000 incidents in Atlantic City, NJ compared to nearest cities:
(Note: Based on data for all years, including only cities with at least 2,500 fire incidents)
| Atlantic City: | 1.3 |
| Vineland: | 1.3 |
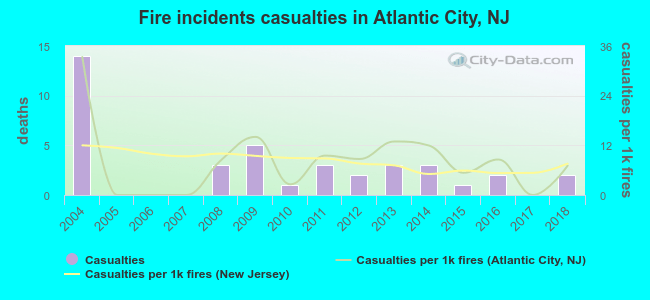 Based on the reports from the years 2004 - 2018 the average number of fire-related yearly casualties is 3. The highest number of reported injuries - 14 took place in 2004, and the lowest - 0 in 2005. The data has a decreasing trend.
The average number of casualties per 1,000 fire incidents is 8. This indicator was the highest - 33 in 2004, and the lowest 0 in 2005. The trend for casualties per 1,000 fire incidents is declining. Compared to the state value the number of casualties per 1,000 fire incidents is similar.
Based on the reports from the years 2004 - 2018 the average number of fire-related yearly casualties is 3. The highest number of reported injuries - 14 took place in 2004, and the lowest - 0 in 2005. The data has a decreasing trend.
The average number of casualties per 1,000 fire incidents is 8. This indicator was the highest - 33 in 2004, and the lowest 0 in 2005. The trend for casualties per 1,000 fire incidents is declining. Compared to the state value the number of casualties per 1,000 fire incidents is similar.Casualties per 1,000 incidents in Atlantic City, NJ compared to nearest cities:
(Note: Based on data for all years, including only cities with at least 500 fire incidents)
| Atlantic City: | 10.3 |
| Brigantine: | 20.8 |
| Pleasantville: | 22.7 |
| Somers Point: | 8.7 |
| Ocean City: | 12.1 |
| Mays Landing: | 1.8 |
| Manahawkin: | 10.8 |
| Hammonton: | 5.4 |
| Cape May Court House: | 11.8 |
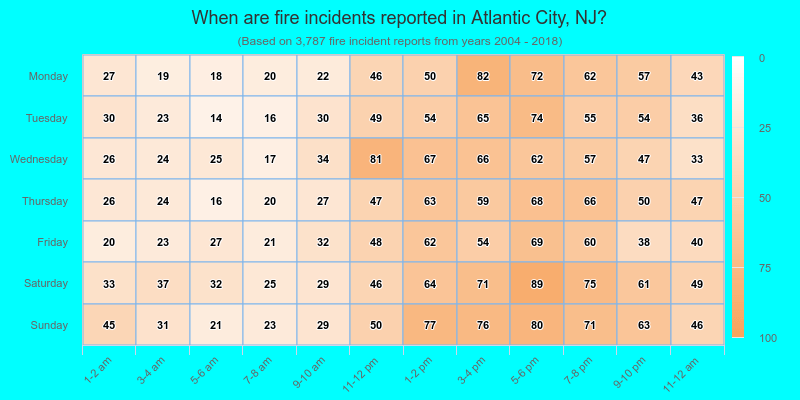
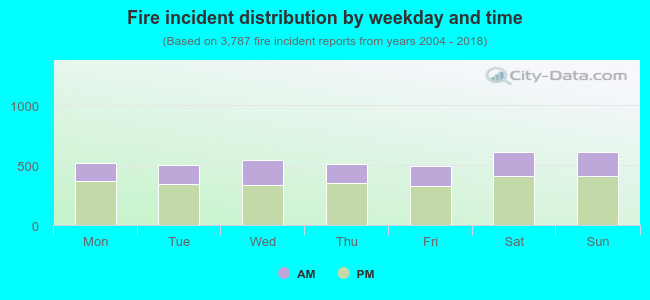 33.1% incidents where reported in the morning and 66.9% in the evening. The most fires (16.2%) took place on Sunday, and the least (13.0%) on Friday.
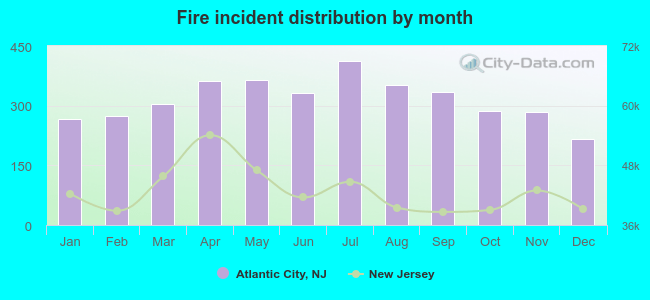 Based on the 3,787 fire incident reports from years 2004 - 2018 most fires (10.9%) took place during July, and the least (5.7%) in December.
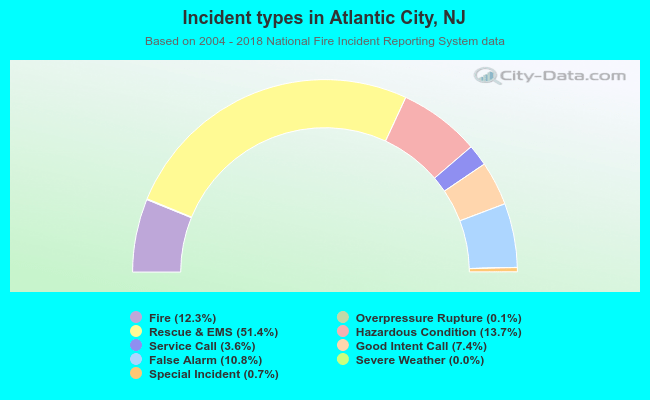 Out of all 30,748 cases reported during the years 2004 - 2018, the most belonged to the categories: Rescue & EMS (51.4%), Hazardous Condition (13.7%), and Fire (12.3%).
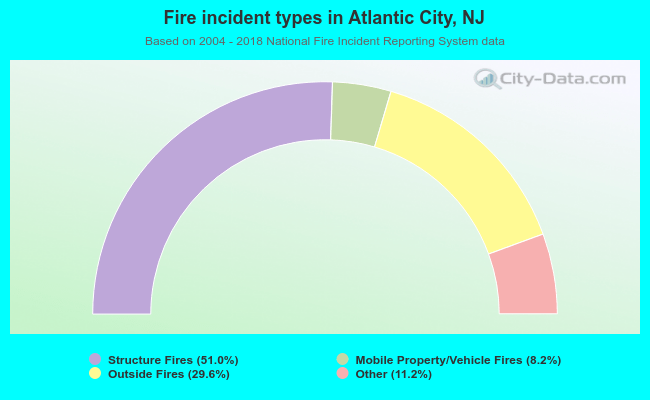 When looking into fire subcategories, the most incidents belonged to: Structure Fires (51.0%), and Outside Fires (29.6%).