Attica: Fire Incidents, Kansas (KS)
Where are fire incidents reported in Attica, KS
Something went wrong! Please refresh the page.
|
| |||||||||||||||||||||||||||||||||||||||||||||||||||||||||||||||||||||||||||||||||||||||||||||||||||||||||||||
| Other | 148 | |||||||||||||||||||||||||||||||||||||||||||||||||||||||||||||||||||||||||||||||||||||||||||||||||||||||||||||
2002 - 2018 National Fire Incident Reporting System (NFIRS) incidents
- Incident types reported to NFIRS in Attica, KS
- 31453.7%Fire
- 16027.4%Rescue & EMS
- 335.6%Hazardous Condition
- 244.1%False Alarm
- 213.6%Severe Weather
- 183.1%Good Intent Call
- 132.2%Service Call
- 10.2%Overpressure Rupture
- 10.2%Special Incident
- Fire incident types reported to NFIRS in Attica, KS
- 22170.4%Outside Fires
- 4815.3%Structure Fires
- 258.0%Other
- 206.4%Mobile Property/Vehicle Fires
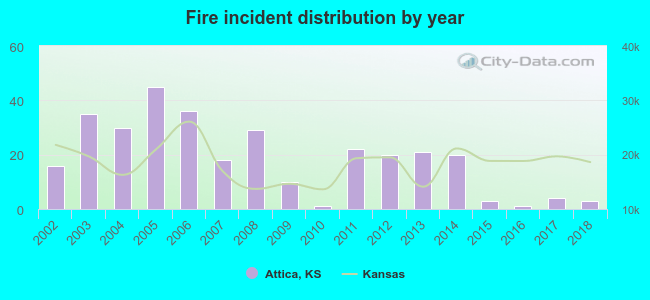 Based on the data from the years 2002 - 2018 the average number of fire incidents per year is 18. The highest number of fires - 45 took place in 2005, and the least - 1 in 2010. The data has a declining trend.
 21.0% incidents where reported in the morning and 79.0% in the evening. The most fires (18.5%) took place on Tuesday, and the least (10.8%) on Saturday.
 Based on the 314 fire incidents from years 2002 - 2018 most fires (24.5%) took place during July, and the least (3.2%) in September.
 Out of all 585 cases reported during the years 2002 - 2018, the most belonged to the categories: Fire (53.7%), Rescue & EMS (27.4%), and Hazardous Condition (5.6%).
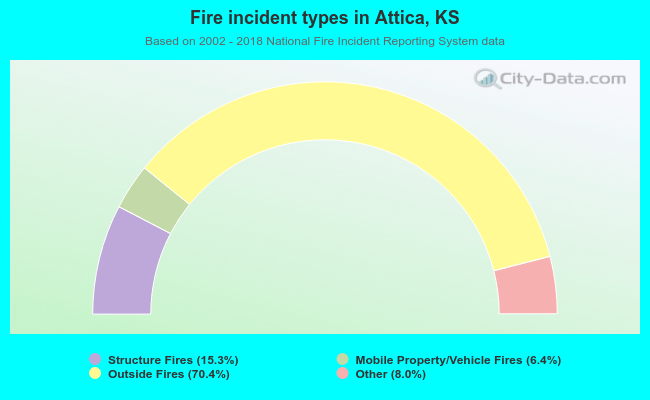 When looking into fire subcategories, the most incidents belonged to: Outside Fires (70.4%), and Structure Fires (15.3%).