Attleboro: Fire Incidents, Massachusetts (MA)
Where are fire incidents reported in Attleboro, MA
Something went wrong! Please refresh the page.
| Fire incidents reported | |
|---|---|
| Sreet name | Count |
| RT 95 HWY | 158 |
| PLEASANT ST | 156 |
| NORTH MAIN ST | 148 |
| PARK ST | 134 |
| NEWPORT AVE | 124 |
| WASHINGTON ST | 124 |
| SOUTH MAIN ST | 122 |
| SOUTH MAIN STREET | 114 |
| COUNTY ST | 112 |
| RT 95 | 102 |
| WASHINGTON STREET | 80 |
| NORTH MAIN STREET | 72 |
| COUNTY STREET | 54 |
| NEWPORT AVE | 54 |
| OAK HILL AVE | 48 |
| PARK STREET | 44 |
| PLEASANT STREET | 36 |
| WEST ST | 34 |
| OAK HILL AVE | 30 |
| SOUTH AVE | 30 |
| THACHER ST | 30 |
| EMORY ST | 28 |
| FOREST STREET | 28 |
| PINE ST | 26 |
| FOREST ST | 22 |
| MAY ST | 22 |
| NORTH AVE | 22 |
| TIFFANY ST | 22 |
| BANK ST | 20 |
| HILLSIDE AVE | 20 |
| Other | 327 |
2002 - 2018 National Fire Incident Reporting System (NFIRS) incidents
- Incident types reported to NFIRS in Attleboro, MA
- 26,43663.4%Rescue & EMS
- 4,67811.2%False Alarm
- 2,7756.7%Good Intent Call
- 2,7486.6%Service Call
- 2,5986.2%Hazardous Condition
- 2,3435.6%Fire
- 830.2%Special Incident
- Fire incident types reported to NFIRS in Attleboro, MA
- 1,05545.0%Outside Fires
- 76232.5%Structure Fires
- 41317.6%Mobile Property/Vehicle Fires
- 1134.8%Other
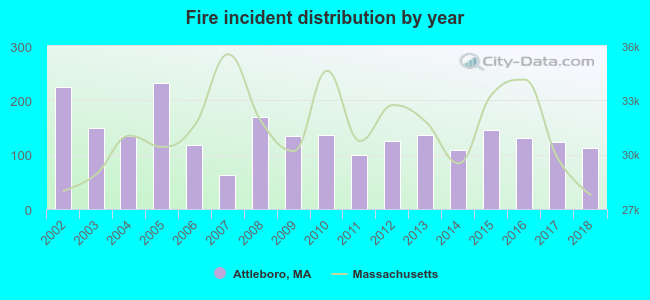 According to the data from the years 2002 - 2018 the average number of fire incidents per year is 138. The highest number of reported fire incidents - 232 took place in 2005, and the least - 62 in 2007. The data has a decreasing trend.
The average number of yearly fire incidents per 10k residents in Attleboro, MA compared to nearest cities:
(Note: Based on data for the last 3 years, including only cities with population 5,000 and above)
| Attleboro: | 27.7 |
| Plainville: | 44.0 |
| Seekonk: | 48.1 |
| Rehoboth: | 33.9 |
| Norton: | 20.0 |
| Mansfield: | 27.7 |
| Wrentham: | 20.1 |
| Foxborough: | 96.0 |
| Dighton: | 12.7 |
 The median response time based on all reported fire incidents is 4 minutes. This is close to the state median value.
The median response time in Attleboro, MA compared to nearest cities:
(Note: Based on data for all years, including only cities with at least 500 fire incidents)
| Attleboro: | 4 minutes |
| Plainville: | 4 minutes |
| Seekonk: | 6 minutes |
| Rehoboth: | 6 minutes |
| Norton: | 4 minutes |
| Mansfield: | 5 minutes |
| Wrentham: | 2 minutes |
| Foxborough: | 5 minutes |
| Taunton: | 4 minutes |
 According to the data from the years 2002 - 2018 the average number of fire-related yearly deaths is 0. The highest number of reported deaths - 2 took place in 2016, and the lowest - 0 in 2002. The data has a constant trend.
 Based on the data from the years 2002 - 2018 the average number of fire-related yearly casualties is 1. The highest number of injuries - 6 took place in 2013, and the lowest - 0 in 2004. The data has a decreasing trend.
The average number of injuries per 1,000 fire incidents is 8. This indicator was the highest - 44 in 2013, and the lowest 0 in 2004. The trend for injuries per 1,000 fire incidents is declining. Compared to the Massachusetts value the number of injuries per 1,000 fires is similar.
Based on the data from the years 2002 - 2018 the average number of fire-related yearly casualties is 1. The highest number of injuries - 6 took place in 2013, and the lowest - 0 in 2004. The data has a decreasing trend.
The average number of injuries per 1,000 fire incidents is 8. This indicator was the highest - 44 in 2013, and the lowest 0 in 2004. The trend for injuries per 1,000 fire incidents is declining. Compared to the Massachusetts value the number of injuries per 1,000 fires is similar.Casualties per 1,000 incidents in Attleboro, MA compared to nearest cities:
(Note: Based on data for all years, including only cities with at least 500 fire incidents)
| Attleboro: | 9.0 |
| Plainville: | 7.6 |
| Seekonk: | 11.2 |
| Rehoboth: | 10.5 |
| Norton: | 18.9 |
| Mansfield: | 21.9 |
| Wrentham: | 0.0 |
| Foxborough: | 5.5 |
| Taunton: | 0.8 |
 30.0% incidents where reported in the morning and 70.0% in the evening. The most fires (15.4%) took place on Sunday, and the least (13.1%) on Thursday.
 According to the 2,343 fire incidents from years 2002 - 2018 most fires (13.7%) took place during April, and the least (4.4%) in December.
 Out of all 41,702 cases reported during the years 2002 - 2018, the most belonged to the categories: Rescue & EMS (63.4%), False Alarm (11.2%), and Good Intent Call (6.7%).
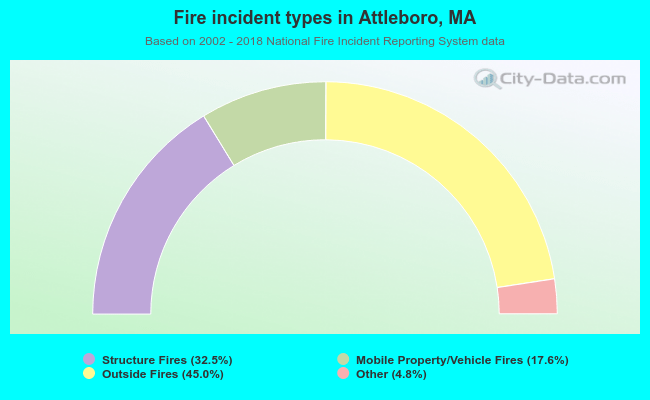 When looking into fire subcategories, the most reports belonged to: Outside Fires (45.0%), and Structure Fires (32.5%).