| Fire incidents reported |
|---|
| Sreet name | Count |
|---|
| MIDDLETON ROAD | 8 | | MAIN ST | 6 | | MONTGOMERY RD | 6 | | SOUTH UNION RD | 6 | | BROWNING RD | 4 | | BUCKSVILLE RD | 4 | | CHANDLERS ROAD | 4 | | FRIENDSHIP RD | 4 | | HUGHES RD | 4 | | MATLOCK LN | 4 | | PEARL ST | 4 | | PETERSON AVE | 4 | | PILOT KNOB ROAD | 4 | | RIVER RD | 4 | | SHARP GARDEN RD | 4 | | SOUTH UNION RD | 4 | | SPRING ST | 4 | | WILSON AVE | 4 | | 1020 LOGAN MILL RD | 2 | | 103 | 2 | | 1041 BROWNING RD | 2 | | 10725 BOWING GREEN RD | 2 | | 10725 BOWLING GREEN RD | 2 | | 112 PEARL ST | 2 | | 1162 SHAKERTOWN RD | 2 |
| | | Fire incidents reported |
|---|
| Sreet name | Count |
|---|
| 1195 DENNIS RD | 2 | | 123 CIRCLE DR | 2 | | 126 GRAHAM AVE | 2 | | 129 SUTTLE LN LOT 6 | 2 | | 1300 SHAKERTOWN RD | 2 | | 136 WASHER RD. | 2 | | 139 PEARL ST | 2 | | 142 PEARL ST | 2 | | 1544 CHANDLERS RD | 2 | | 1600 CEMETERY RD | 2 | | 165 MONTGOMERY RD | 2 | | 172 ROOSELVELT ST | 2 | | 174 AMANDA GORDON ST | 2 | | 1760 TURNER RD | 2 | | 178 ECHO VALLEY RD | 2 | | 1876 PLAINVIEW CH RD | 2 | | 1928 BUCKSVILLE RD | 2 | | 2000 BROWNING RD | 2 | | 204 VIERS ST | 2 | | 2203 ECHO VALLEY RD | 2 | | 221 COLLEGE ST | 2 | | 225 LINCOLN ST | 2 | | 237 HOWLETT DR | 2 | | 238 ROCK CASTLE CH RD | 2 | | |
|
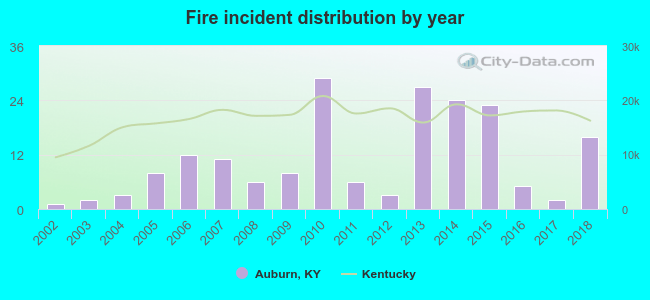 Based on the data from the years 2002 - 2018 the average number of fires per year is 11. The highest number of reported fire incidents - 29 took place in 2010, and the least - 1 in 2002. The data has a growing trend.
 36.0% incidents where reported in the morning and 64.0% in the evening. The most fires (19.4%) took place on Saturday, and the least (12.4%) on Wednesday.
 Based on the 186 incident reports from years 2002 - 2018 most fires (12.9%) took place during February, and the least (4.8%) in July.
 Out of all 413 cases reported during the years 2002 - 2018, the most belonged to the categories: Fire (45.0%), Hazardous Condition (21.5%), and Rescue & EMS (14.3%).
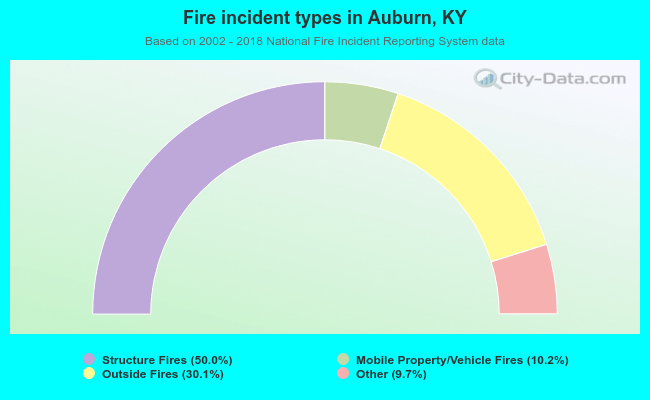 When looking into fire subcategories, the most incidents belonged to: Structure Fires (50.0%), and Outside Fires (30.1%).