Audubon: Fire Incidents, New Jersey (NJ)
Where are fire incidents reported in Audubon, NJ
Something went wrong! Please refresh the page.
| Fire incidents reported | |
|---|---|
| Sreet name | Count |
| WHITE HORSE PIKE | 104 |
| NICHOLSON RD | 96 |
| MERCHANT ST | 62 |
| WHITE HORSE | 62 |
| BLACK HORSE | 60 |
| GRAISBURY AVE | 38 |
| CHESTNUT ST | 36 |
| PINE ST | 32 |
| ATLANTIC AVE | 30 |
| ATLANTIC | 26 |
| BARRETT | 26 |
| EDGEWOOD | 24 |
| BLACK HORSE PIKE | 22 |
| MAPLE AVE | 22 |
| AMHERST RD | 20 |
| MANSION AVE | 20 |
| OAKLAND AVE | 20 |
| KINGS HWY | 18 |
| OAKLAND | 18 |
| PAYSON | 18 |
| WASHINGTON | 18 |
| YALE RD | 18 |
| CARLISLE RD | 16 |
| CEDARCROFT AVE | 16 |
| HAVILAND | 16 |
| OAK ST | 16 |
| WASHINGTON TER | 16 |
| DAVIS | 14 |
| PAYSON AVE | 14 |
| AUDUBON AVE | 12 |
2002 - 2018 National Fire Incident Reporting System (NFIRS) incidents
- Incident types reported to NFIRS in Audubon, NJ
- 86133.9%Hazardous Condition
- 64825.5%Fire
- 30712.1%Good Intent Call
- 29411.6%False Alarm
- 2379.3%Rescue & EMS
- 1686.6%Service Call
- 140.6%Severe Weather
- 60.2%Special Incident
- Fire incident types reported to NFIRS in Audubon, NJ
- 43867.6%Structure Fires
- 14722.7%Outside Fires
- 426.5%Mobile Property/Vehicle Fires
- 213.2%Other
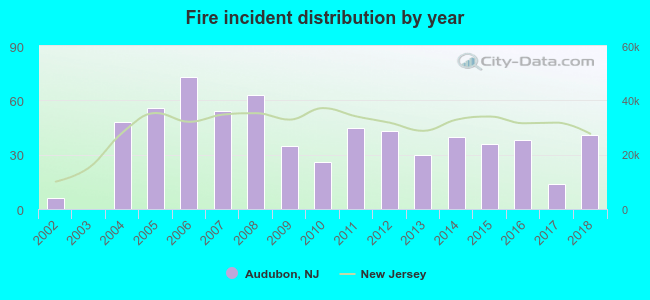 Based on the data from the years 2002 - 2018 the average number of fires per year is 38. The highest number of fires - 73 took place in 2006, and the least - 0 in 2003. The data has an increasing trend.
The average number of yearly fire incidents per 10k residents in Audubon, NJ compared to nearest cities:
(Note: Based on data for the last 3 years, including only cities with population 5,000 and above)
| Audubon: | 35.6 |
| Haddon Heights: | 29.4 |
| Barrington: | 61.0 |
| Collingswood: | 84.3 |
| Haddonfield: | 26.9 |
| Bellmawr: | 51.2 |
| Gloucester City: | 52.7 |
| Runnemede: | 46.2 |
| Camden: | 55.5 |
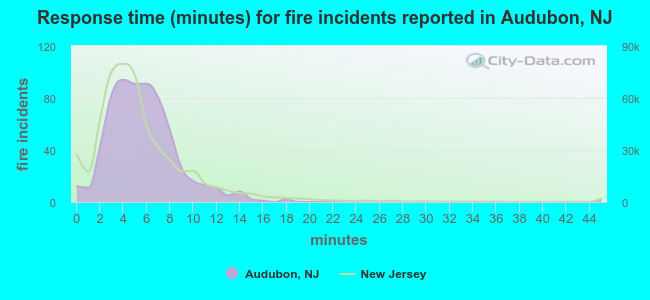 The median response time based on all reported fire incidents is 5 minutes. This is similar to the state median value.
The median response time in Audubon, NJ compared to nearest cities:
(Note: Based on data for all years, including only cities with at least 500 fire incidents)
| Audubon: | 5 minutes |
| Haddon Heights: | 6 minutes |
| Barrington: | 7 minutes |
| Collingswood: | 4 minutes |
| Haddonfield: | 6 minutes |
| Bellmawr: | 6 minutes |
| Gloucester City: | 4 minutes |
| Runnemede: | 7 minutes |
| Magnolia: | 6 minutes |
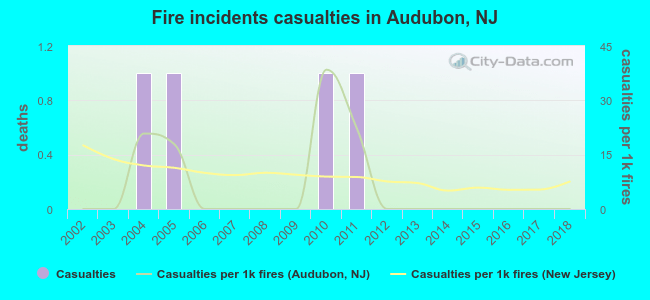 According to the reports from the years 2002 - 2018 the average number of fire-related casualties per year is 0. The highest number of reported injuries - 1 took place in 2004, and the lowest - 0 in 2002. The data has a constant trend.
The average number of casualties per 1,000 fires is 6. This indicator was the highest - 38 in 2010, and the lowest 0 in 2002. The trend for casualties per 1,000 incidents is rising. Compared to the state value the number of injuries per 1,000 fires is lower.
According to the reports from the years 2002 - 2018 the average number of fire-related casualties per year is 0. The highest number of reported injuries - 1 took place in 2004, and the lowest - 0 in 2002. The data has a constant trend.
The average number of casualties per 1,000 fires is 6. This indicator was the highest - 38 in 2010, and the lowest 0 in 2002. The trend for casualties per 1,000 incidents is rising. Compared to the state value the number of injuries per 1,000 fires is lower.Casualties per 1,000 incidents in Audubon, NJ compared to nearest cities:
(Note: Based on data for all years, including only cities with at least 500 fire incidents)
| Audubon: | 6.2 |
| Haddon Heights: | 3.8 |
| Barrington: | 0.0 |
| Collingswood: | 13.0 |
| Haddonfield: | 1.4 |
| Bellmawr: | 13.4 |
| Gloucester City: | 7.4 |
| Runnemede: | 0.0 |
| Magnolia: | 5.7 |
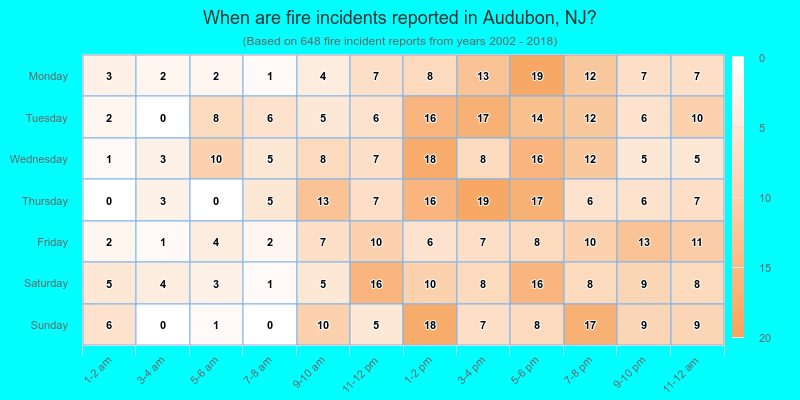
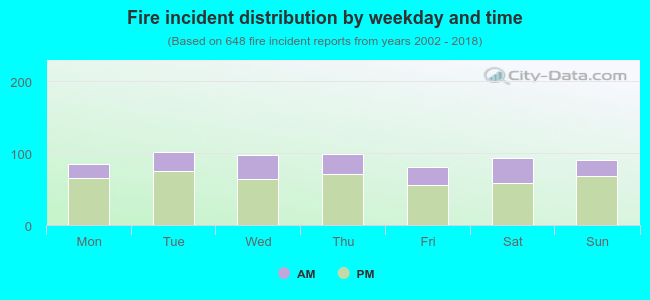 29.3% incidents where reported in the morning and 70.7% in the evening. The most fires (15.7%) took place on Tuesday, and the least (12.5%) on Friday.
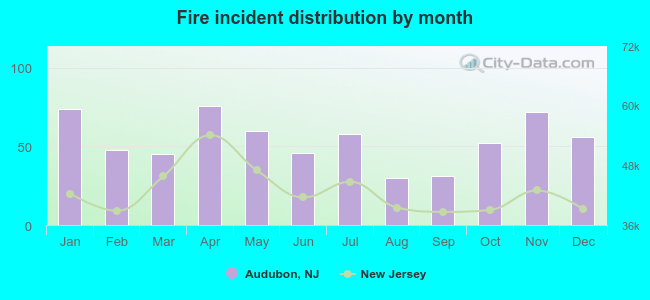 According to the 648 fires from years 2002 - 2018 most fires (11.7%) took place during April, and the least (4.6%) in August.
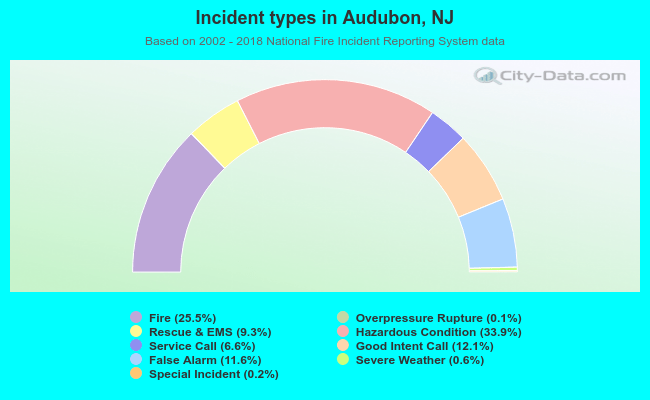 Out of all 2,537 cases reported during the years 2002 - 2018, the most belonged to the categories: Hazardous Condition (33.9%), Fire (25.5%), and Good Intent Call (12.1%).
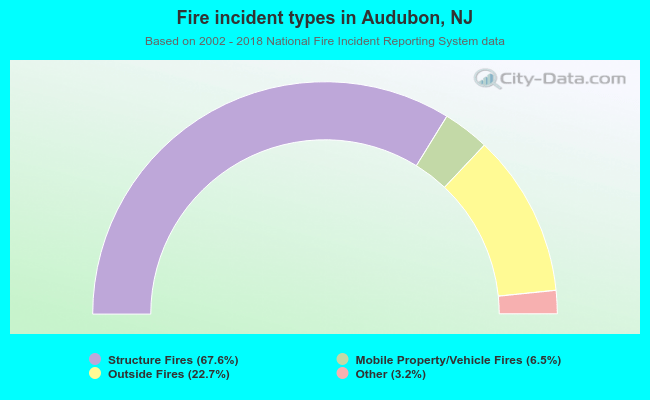 When looking into fire subcategories, the most reports belonged to: Structure Fires (67.6%), and Outside Fires (22.7%).