Audubon Park: Fire Incidents, New Jersey (NJ)
Where are fire incidents reported in Audubon Park, NJ
Something went wrong! Please refresh the page.
|
| |||||||||||||||||||||||||||||||||||||||||||||||||||||||||||||||||||||||||||||||||||||||||||||||||||||||||||||
2002 - 2018 National Fire Incident Reporting System (NFIRS) incidents
- Incident types reported to NFIRS in Audubon Park, NJ
- 18639.6%Hazardous Condition
- 16535.1%Fire
- 428.9%Service Call
- 357.4%False Alarm
- 204.3%Good Intent Call
- 173.6%Rescue & EMS
- 20.4%Severe Weather
- 20.4%Special Incident
- 10.2%Overpressure Rupture
- Fire incident types reported to NFIRS in Audubon Park, NJ
- 8149.1%Structure Fires
- 6438.8%Outside Fires
- 137.9%Other
- 74.2%Mobile Property/Vehicle Fires
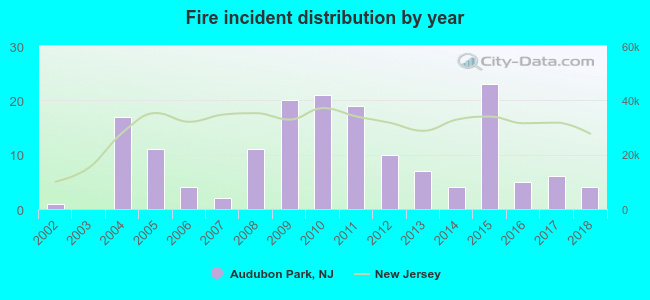 According to the data from the years 2002 - 2018 the average number of fires per year is 10. The highest number of reported fires - 23 took place in 2015, and the least - 0 in 2003. The data has a rising trend.
 22.4% incidents where reported in the morning and 77.6% in the evening. The most fires (17.0%) took place on Wednesday, and the least (7.9%) on Saturday.
 Based on the 165 reports from years 2002 - 2018 most fires (25.5%) took place during January, and the least (2.4%) in July.
 Out of all 470 cases reported during the years 2002 - 2018, the most belonged to the categories: Hazardous Condition (39.6%), Fire (35.1%), and Service Call (8.9%).
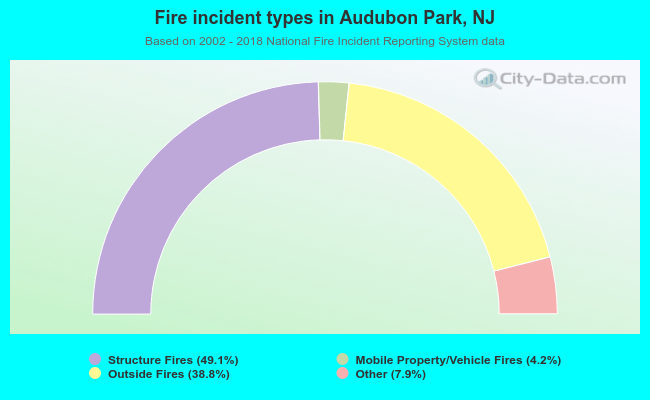 When looking into fire subcategories, the most incidents belonged to: Structure Fires (49.1%), and Outside Fires (38.8%).