Avenel: Fire Incidents, New Jersey (NJ)
Where are fire incidents reported in Avenel, NJ
Something went wrong! Please refresh the page.
|
| |||||||||||||||||||||||||||||||||||||||||||||||||||||||||||||||||||||||||||||||||||||||||||||||||||||||||||||
2002 - 2018 National Fire Incident Reporting System (NFIRS) incidents
- Incident types reported to NFIRS in Avenel, NJ
- 1,06232.9%Hazardous Condition
- 67420.9%False Alarm
- 63219.6%Fire
- 46814.5%Service Call
- 2176.7%Good Intent Call
- 1645.1%Rescue & EMS
- 100.3%Special Incident
- 40.1%Overpressure Rupture
- Fire incident types reported to NFIRS in Avenel, NJ
- 30147.6%Structure Fires
- 21634.2%Outside Fires
- 9014.2%Mobile Property/Vehicle Fires
- 254.0%Other
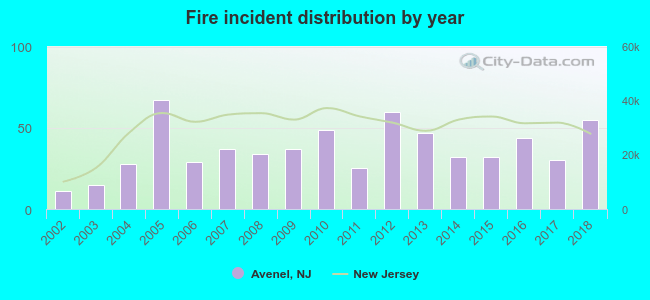 According to the data from the years 2002 - 2018 the average number of fires per year is 37. The highest number of reported fires - 67 took place in 2005, and the least - 11 in 2002. The data has a rising trend.
The average number of yearly fire incidents per 10k residents in Avenel, NJ compared to nearest cities:
(Note: Based on data for the last 3 years, including only cities with population 5,000 and above)
| Avenel: | 25.3 |
| Rahway: | 51.8 |
| Woodbridge: | 34.1 |
| Colonia: | 16.5 |
| Iselin: | 22.5 |
| Carteret: | 24.1 |
| Clark: | 30.3 |
| Fords: | 1.1 |
| Linden: | 28.5 |
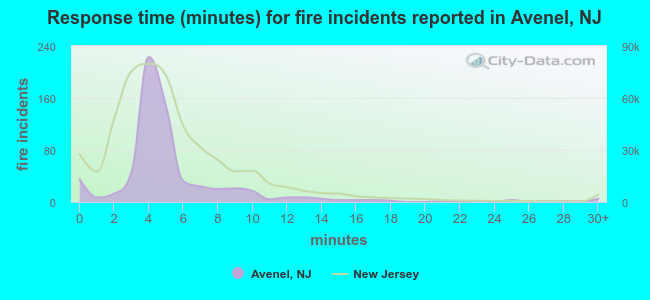 The median response time based on all reported fire incidents is 4 minutes. This is lower compared to the New Jersey median value.
The median response time in Avenel, NJ compared to nearest cities:
(Note: Based on data for all years, including only cities with at least 500 fire incidents)
| Avenel: | 4 minutes |
| Rahway: | 3 minutes |
| Woodbridge: | 5 minutes |
| Colonia: | 5 minutes |
| Iselin: | 5 minutes |
| Carteret: | 3 minutes |
| Clark: | 6 minutes |
| Linden: | 4 minutes |
| Perth Amboy: | 4 minutes |
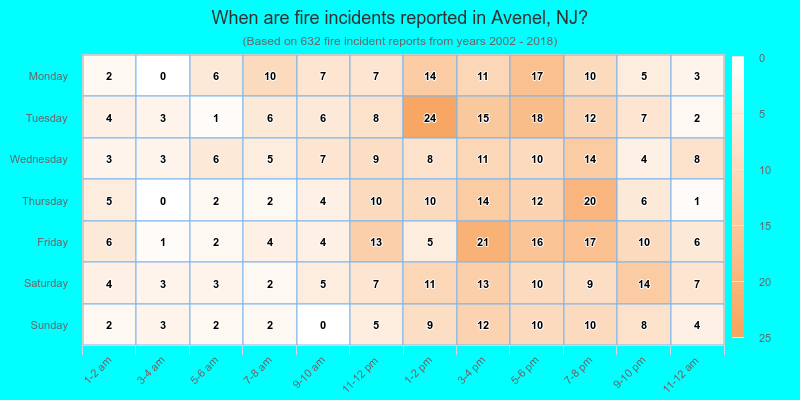
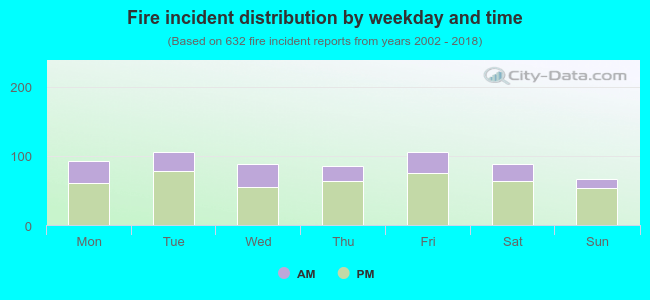 29.1% incidents where reported in the morning and 70.9% in the evening. The most fires (16.8%) took place on Tuesday, and the least (10.6%) on Sunday.
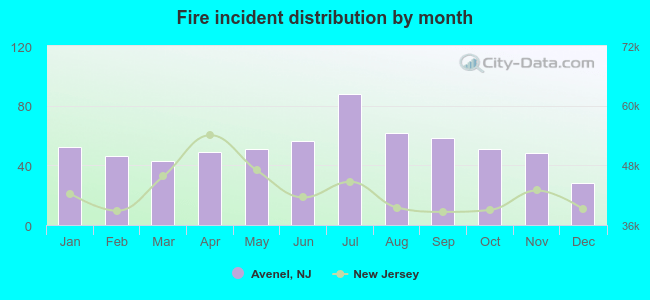 Based on the 632 incident reports from years 2002 - 2018 most fires (13.9%) took place during July, and the least (4.4%) in December.
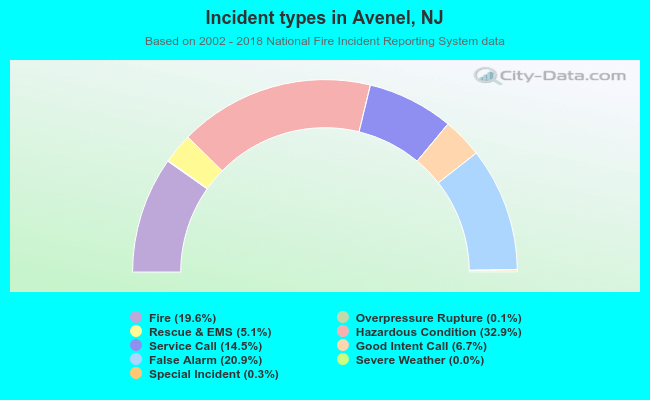 Out of all 3,232 cases reported during the years 2002 - 2018, the most belonged to the categories: Hazardous Condition (32.9%), False Alarm (20.9%), and Fire (19.6%).
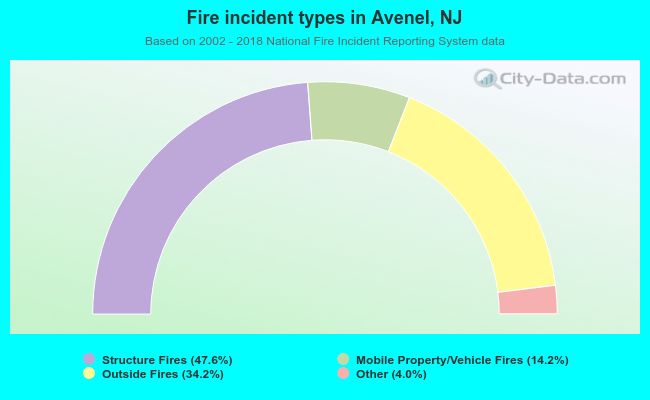 When looking into fire subcategories, the most reports belonged to: Structure Fires (47.6%), and Outside Fires (34.2%).