Avinger: Fire Incidents, Texas (TX)
Where are fire incidents reported in Avinger, TX
Something went wrong! Please refresh the page.
|
| |||||||||||||||||||||||||||||||||||||||||||||||||||||||||||||||||||||||||||||||||||||||||||||||||||||||||||||
2003 - 2017 National Fire Incident Reporting System (NFIRS) incidents
- Incident types reported to NFIRS in Avinger, TX
- 41058.5%Fire
- 22532.1%Rescue & EMS
- 294.1%Hazardous Condition
- 172.4%Good Intent Call
- 131.9%Service Call
- 50.7%False Alarm
- 10.1%Severe Weather
- 10.1%Special Incident
- Fire incident types reported to NFIRS in Avinger, TX
- 26464.4%Outside Fires
- 11929.0%Structure Fires
- 235.6%Mobile Property/Vehicle Fires
- 41.0%Other
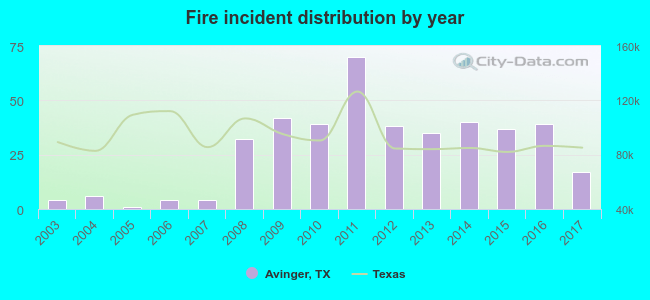 According to the data from the years 2003 - 2017 the average number of fires per year is 27. The highest number of reported fire incidents - 70 took place in 2011, and the least - 1 in 2005. The data has an increasing trend.
 Based on the data from the years 2003 - 2017 the average number of fire-related yearly deaths is 0. The highest number of deaths - 1 took place in 2013, and the lowest - 0 in 2003. The data has a constant trend.
 27.8% incidents where reported in the morning and 72.2% in the evening. The most fires (18.5%) took place on Thursday, and the least (12.4%) on Tuesday.
 According to the 410 reports from years 2003 - 2017 most fires (13.9%) took place during March, and the least (3.7%) in May.
 Out of all 701 cases reported during the years 2003 - 2017, the most belonged to the categories: Fire (58.5%), Overpressure Rupture (32.1%), and Rescue & EMS (4.1%).
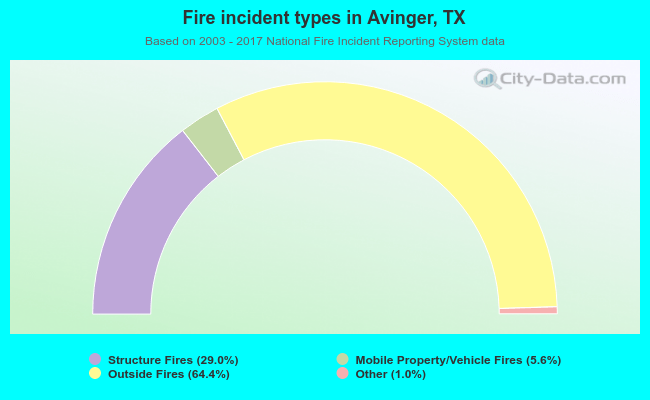 When looking into fire subcategories, the most reports belonged to: Outside Fires (64.4%), and Structure Fires (29.0%).