Avon: Fire Incidents, Massachusetts (MA)
Where are fire incidents reported in Avon, MA
Something went wrong! Please refresh the page.
| Fire incidents reported | |
|---|---|
| Sreet name | Count |
| STOCKWELL DR | 138 |
| RTE. 24 NORTH OF HARRISON | 100 |
| HARRISON BLVD | 86 |
| RTE. 24 SOUTH OF HARRISON | 64 |
| EAST MAIN ST | 62 |
| BODWELL ST | 54 |
| WEST MAIN ST | 52 |
| MEMORIAL DR | 50 |
| PAGE ST | 42 |
| LEDIN DR | 40 |
| RTE 24 NORTH OF HARRISON | 36 |
| DW FIELDS PARK | 34 |
| CENTRAL ST | 28 |
| POND ST | 28 |
| RTE 24 SOUTH OF HARRISON | 26 |
| MAIN ST | 22 |
| SOUTH ST | 22 |
| EAST HIGH ST | 20 |
| NORTH MAIN ST | 20 |
| WALES AVE | 20 |
| D.W. FIELDS PARK | 16 |
| EAST SPRING STREET | 16 |
| EAST SPRING ST | 14 |
| CONNOLLY RD | 12 |
| EAST ST | 12 |
| FELLOWSHIP CIR | 12 |
| FREEMAN ST | 12 |
| STOCKWELL DRIVE | 12 |
| WEST HIGH ST | 12 |
| WEST HIGH ST | 12 |
2002 - 2018 National Fire Incident Reporting System (NFIRS) incidents
- Incident types reported to NFIRS in Avon, MA
- 3,76250.2%Rescue & EMS
- 88311.8%Service Call
- 79510.6%Hazardous Condition
- 75610.1%Fire
- 6448.6%Good Intent Call
- 6318.4%False Alarm
- 110.1%Overpressure Rupture
- 90.1%Special Incident
- Fire incident types reported to NFIRS in Avon, MA
- 25433.6%Outside Fires
- 24432.3%Mobile Property/Vehicle Fires
- 19625.9%Structure Fires
- 628.2%Other
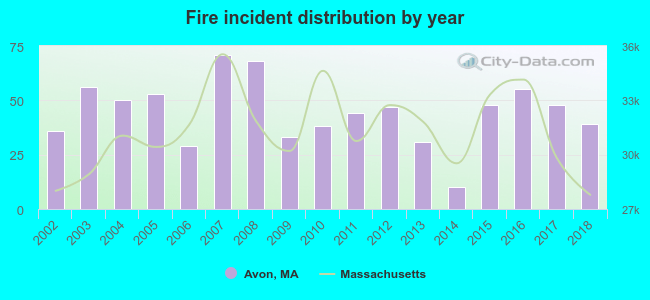 Based on the data from the years 2002 - 2018 the average number of fires per year is 44. The highest number of reported fire incidents - 71 took place in 2007, and the least - 10 in 2014. The data has a growing trend.
 The median response time based on all reported fire incidents is 4 minutes. This is about the same as the Massachusetts median value.
The median response time in Avon, MA compared to nearest cities:
(Note: Based on data for all years, including only cities with at least 500 fire incidents)
| Avon: | 4 minutes |
| Holbrook: | 3 minutes |
| Brockton: | 4 minutes |
| Stoughton: | 3 minutes |
| Randolph: | 3 minutes |
| Abington: | 4 minutes |
| Canton: | 5 minutes |
| Easton: | 5 minutes |
| Whitman: | 2 minutes |
 Based on the reports from the years 2002 - 2018 the average number of fire-related casualties per year is 1. The highest number of reported injuries - 5 took place in 2018, and the lowest - 0 in 2002. The data has a rising trend.
The average number of injuries per 1,000 fires is 14. This indicator was the highest - 128 in 2018, and the lowest 0 in 2002. The trend for casualties per 1,000 fire incidents is rising. Compared to the state value the number of casualties per 1,000 fire incidents is higher.
Based on the reports from the years 2002 - 2018 the average number of fire-related casualties per year is 1. The highest number of reported injuries - 5 took place in 2018, and the lowest - 0 in 2002. The data has a rising trend.
The average number of injuries per 1,000 fires is 14. This indicator was the highest - 128 in 2018, and the lowest 0 in 2002. The trend for casualties per 1,000 fire incidents is rising. Compared to the state value the number of casualties per 1,000 fire incidents is higher.
 34.0% incidents where reported in the morning and 66.0% in the evening. The most fires (16.5%) took place on Thursday, and the least (11.6%) on Sunday.
 Based on the 756 fires from years 2002 - 2018 most fires (11.9%) took place during August, and the least (6.0%) in February.
 Out of all 7,494 cases reported during the years 2002 - 2018, the most belonged to the categories: Rescue & EMS (50.2%), Service Call (11.8%), and Hazardous Condition (10.6%).
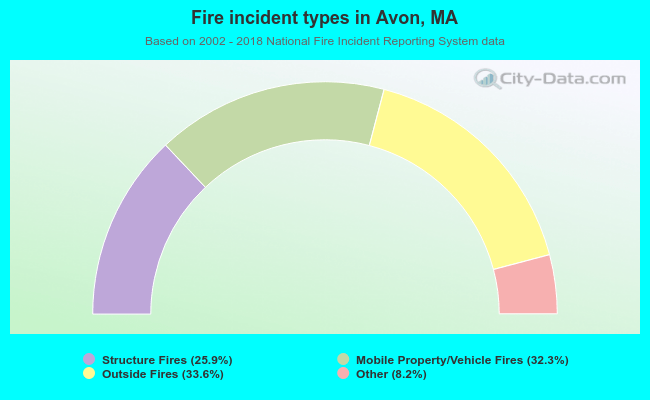 When looking into fire subcategories, the most incidents belonged to: Outside Fires (33.6%), and Mobile Property/Vehicle Fires (32.3%).