Bagley: Fire Incidents, Minnesota (MN)
Where are fire incidents reported in Bagley, MN
Something went wrong! Please refresh the page.
|
| |||||||||||||||||||||||||||||||||||||||||||||||||||||||||||||||||||||||||||||||||||||||||||||||||||||||||||||
| Other | 17 | |||||||||||||||||||||||||||||||||||||||||||||||||||||||||||||||||||||||||||||||||||||||||||||||||||||||||||||
2003 - 2018 National Fire Incident Reporting System (NFIRS) incidents
- Incident types reported to NFIRS in Bagley, MN
- 30367.6%Fire
- 398.7%Hazardous Condition
- 368.0%Rescue & EMS
- 368.0%Good Intent Call
- 173.8%False Alarm
- 102.2%Service Call
- 51.1%Severe Weather
- 20.4%Special Incident
- Fire incident types reported to NFIRS in Bagley, MN
- 13143.2%Structure Fires
- 11838.9%Outside Fires
- 4615.2%Mobile Property/Vehicle Fires
- 82.6%Other
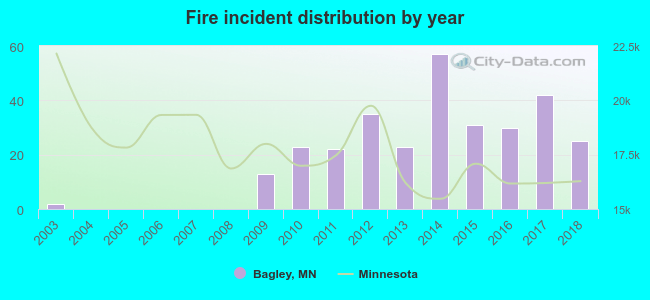 According to the data from the years 2003 - 2018 the average number of fires per year is 19. The highest number of fire incidents - 57 took place in 2014, and the least - 0 in 2004. The data has a rising trend.
 27.4% incidents where reported in the morning and 72.6% in the evening. The most fires (16.5%) took place on Sunday, and the least (12.2%) on Monday.
 According to the 303 incident reports from years 2003 - 2018 most fires (18.2%) took place during April, and the least (4.3%) in August.
 Out of all 448 cases reported during the years 2003 - 2018, the most belonged to the categories: Fire (67.6%), Rescue & EMS (8.7%), and Overpressure Rupture (8.0%).
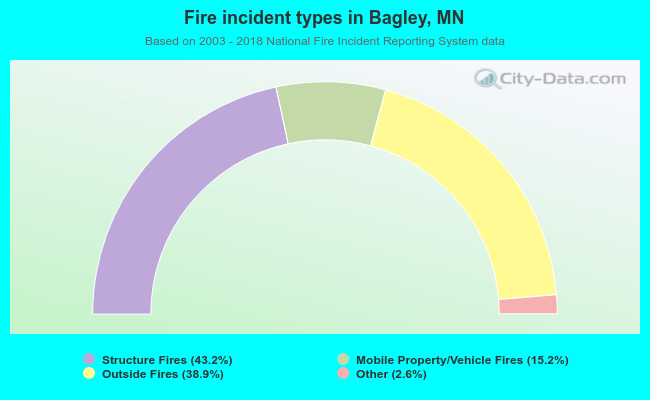 When looking into fire subcategories, the most reports belonged to: Structure Fires (43.2%), and Outside Fires (38.9%).