Bainbridge: Fire Incidents, Indiana (IN)
Where are fire incidents reported in Bainbridge, IN
Something went wrong! Please refresh the page.
|
| |||||||||||||||||||||||||||||||||||||||||||||||||||||||||||||||||||||||||||||||||||||||||||||||||||||||||||||
2002 - 2018 National Fire Incident Reporting System (NFIRS) incidents
- Incident types reported to NFIRS in Bainbridge, IN
- 26462.7%Fire
- 7217.1%Rescue & EMS
- 368.6%Good Intent Call
- 317.4%Hazardous Condition
- 133.1%Service Call
- 41.0%Severe Weather
- 10.2%Special Incident
- Fire incident types reported to NFIRS in Bainbridge, IN
- 13852.3%Structure Fires
- 7929.9%Outside Fires
- 3312.5%Other
- 145.3%Mobile Property/Vehicle Fires
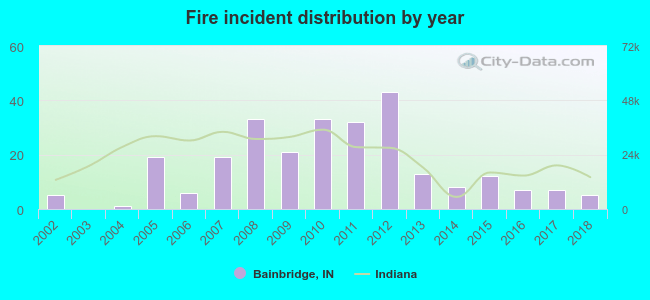 According to the data from the years 2002 - 2018 the average number of fires per year is 16. The highest number of reported fire incidents - 43 took place in 2012, and the least - 0 in 2003. The data has a constant trend.
 33.3% incidents where reported in the morning and 66.7% in the evening. The most fires (15.9%) took place on Saturday, and the least (12.9%) on Tuesday.
 Based on the 264 fire incident reports from years 2002 - 2018 most fires (10.6%) took place during April, and the least (5.7%) in September.
 Out of all 421 cases reported during the years 2002 - 2018, the most belonged to the categories: Fire (62.7%), Overpressure Rupture (17.1%), and Service Call (8.6%).
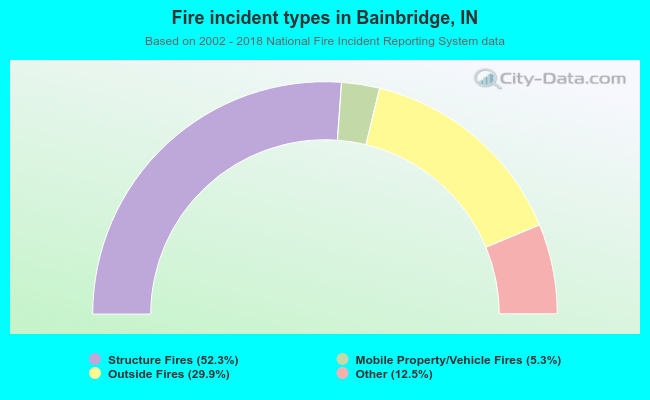 When looking into fire subcategories, the most incidents belonged to: Structure Fires (52.3%), and Outside Fires (29.9%).