Baldwin: Fire Incidents, Louisiana (LA)
Where are fire incidents reported in Baldwin, LA
Something went wrong! Please refresh the page.
|
| |||||||||||||||||||||||||||||||||||||||||||||||||||||||||||||||||||||||||||||||||||||||||||||||||||||||||||||
2002 - 2018 National Fire Incident Reporting System (NFIRS) incidents
- Incident types reported to NFIRS in Baldwin, LA
- 24034.7%Rescue & EMS
- 23534.0%Fire
- 7110.3%Good Intent Call
- 659.4%Hazardous Condition
- 405.8%False Alarm
- 344.9%Service Call
- 40.6%Overpressure Rupture
- 20.3%Special Incident
- 10.1%Severe Weather
- Fire incident types reported to NFIRS in Baldwin, LA
- 11348.1%Structure Fires
- 6326.8%Outside Fires
- 3514.9%Mobile Property/Vehicle Fires
- 2410.2%Other
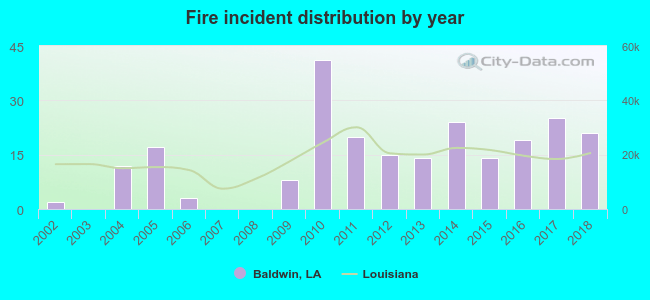 Based on the data from the years 2002 - 2018 the average number of fire incidents per year is 14. The highest number of reported fire incidents - 41 took place in 2010, and the least - 0 in 2003. The data has an increasing trend.
 32.3% incidents where reported in the morning and 67.7% in the evening. The most fires (18.7%) took place on Tuesday, and the least (11.1%) on Monday.
 According to the 235 incident reports from years 2002 - 2018 most fires (14.5%) took place during April, and the least (3.8%) in November.
 Out of all 692 cases reported during the years 2002 - 2018, the most belonged to the categories: Rescue & EMS (34.7%), Fire (34.0%), and Good Intent Call (10.3%).
 When looking into fire subcategories, the most incidents belonged to: Structure Fires (48.1%), and Outside Fires (26.8%).