| Fire incidents reported |
|---|
| Sreet name | Count |
|---|
| DANIELS RD | 18 | | BURMA RD | 14 | | HIGHWAY 1204 HWY | 12 | | SPRINGHILL RD | 12 | | HIGHWAY 165 | 10 | | ROBERTSON RD | 10 | | NUGENT DR | 8 | | BALL LOOP | 6 | | CAMP LIVINGSTON RD | 6 | | DAINELS RD | 6 | | HWY 165 | 6 | | MONROE HIGHWAY | 6 | | POWELL DR | 6 | | 1204 HWY | 4 | | BALL LOOP TRL | 4 | | BEESON DR | 4 | | BIRCH TRACE | 4 | | BIRCH TRCE | 4 | | CAMP LIVINGSTON | 4 | | CRAWFORD LOOP | 4 | | EASTBROOK TRCE | 4 | | HIGHWAY 165 HWY | 4 | | HWY 1204 | 4 | | MCRAY DR | 4 | | MONROE HWY | 4 |
| | | Fire incidents reported |
|---|
| Sreet name | Count |
|---|
| MONROE HWY | 4 | | MONROE ST | 4 | | ORIOLE LN | 4 | | ROBERTSON ROAD | 4 | | SHANGHAI RD | 4 | | WANDA TRL | 4 | | WASHBOARD RD | 4 | | WOODLAWN DR | 4 | | 1 CAMP LIVINGSTON RD . | 2 | | 1101 HONEYSUCKLE LN. | 2 | | 115 WAGGOROER RD | 2 | | 1200 ORIOLE LN . | 2 | | 1228 CARDINAL LANE | 2 | | 165 HWY | 2 | | 165 MONROE HWY | 2 | | 199 BARNEY DURAND RD | 2 | | 216 BEESON DR | 2 | | 216 PARADIES RD. | 2 | | 224 ROBERTSON RD | 2 | | 394 PINEHILL RD | 2 | | 4905 LAURA AV BEHIND PARADIES | 2 | | 4916 MONROE HWY | 2 | | 54 BURMA RD | 2 | | 5508 MONROE HWY | 2 | | 5707 SHELTON RD. | 2 |
|
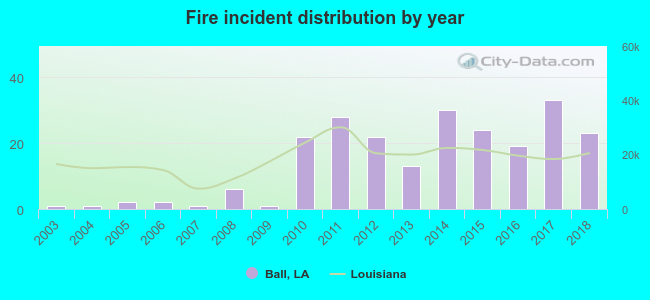 Based on the data from the years 2003 - 2018 the average number of fire incidents per year is 14. The highest number of reported fire incidents - 33 took place in 2017, and the least - 1 in 2003. The data has an increasing trend.
 26.3% incidents where reported in the morning and 73.7% in the evening. The most fires (17.5%) took place on Wednesday, and the least (10.5%) on Thursday.
 According to the 228 incident reports from years 2003 - 2018 most fires (18.9%) took place during January, and the least (1.8%) in June.
 Out of all 1,832 cases reported during the years 2003 - 2018, the most belonged to the categories: Rescue & EMS (73.3%), Fire (12.4%), and Hazardous Condition (4.6%).
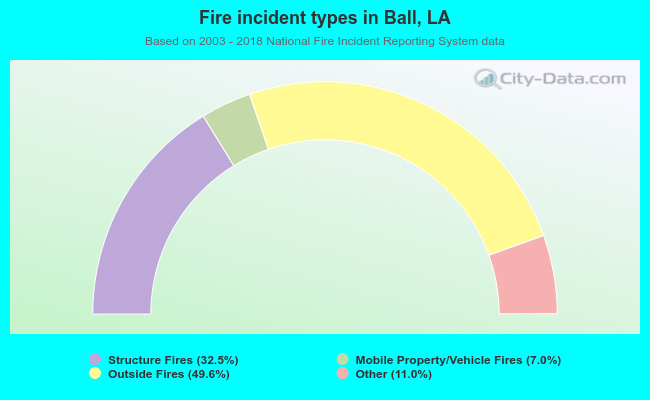 When looking into fire subcategories, the most incidents belonged to: Outside Fires (49.6%), and Structure Fires (32.5%).