| Fire incidents reported |
|---|
| Sreet name | Count |
|---|
| MAIN ST | 10 | | WHARTONS DOCK RD | 10 | | ENGLISH HOLLOW | 8 | | LAKESHORE DR | 8 | | 16 HWY | 6 | | 173 HWY | 6 | | CHIPMAN COURT | 6 | | ENGLISH CROSSING | 6 | | FM 1077 | 6 | | PRIVATE ROAD 1518 RD | 6 | | SH 173 S | 6 | | 100 ROPERS LN | 4 | | 1540 BROAD OAK | 4 | | 2830 FM 1077 | 4 | | 374 DALLAS ST | 4 | | 4149 SH 173 HWY | 4 | | 4324 FM 1077 | 4 | | 556 SETH CIR | 4 | | BEACH SHORE DR | 4 | | ELM PASS | 4 | | FLYING L RANCH RD | 4 | | FM 1077 HWY | 4 | | OAK LAWN DR | 4 | | PANTHER HOLLOW | 4 | | 1050 ELM PASS RD | 2 |
| | | Fire incidents reported |
|---|
| Sreet name | Count |
|---|
| 1075 OLD HONDO HWY | 2 | | 1106 CHERRY | 2 | | 1178 S 173 | 2 | | 128 FRONTIER LN | 2 | | 1321 COMANCHE PATH | 2 | | 134 CARLA LN | 2 | | 1400 PANTHER HOLLOW | 2 | | 1468 PEACEFUL VALLEY | 2 | | 1487 PEACEFUL VALLEY | 2 | | 1500TOBIN RANCH RD | 2 | | 1580 HAY HOLLAR RD | 2 | | 16 N HWY | 2 | | 170 DIANA DR | 2 | | 173 N. 1022 | 2 | | 180 SETH CIR | 2 | | 188 KINS RANCH RD | 2 | | 190 FORT WORTH | 2 | | 1927 SCHMIDTKE RD | 2 | | 194 FIREWHEEL | 2 | | 200 OAK MAN RDG | 2 | | 2000 ENGLISH CROSSING | 2 | | 2027 FM2828 | 2 | | 210 APPLE LN | 2 | | 2229PEACEFULL VALLEY RD | 2 | | |
|
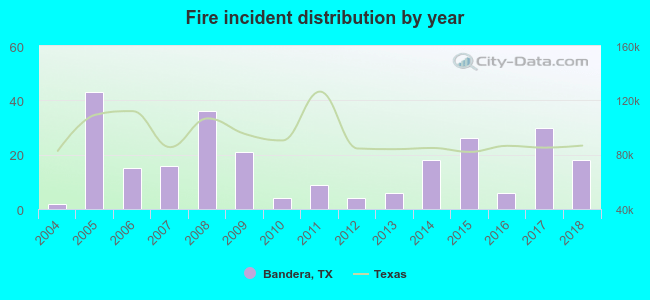 Based on the data from the years 2004 - 2018 the average number of fires per year is 17. The highest number of reported fire incidents - 43 took place in 2005, and the least - 2 in 2004. The data has a rising trend.
 24.8% incidents where reported in the morning and 75.2% in the evening. The most fires (15.7%) took place on Monday, and the least (10.6%) on Tuesday.
 Based on the 254 reports from years 2004 - 2018 most fires (17.3%) took place during January, and the least (4.3%) in September.
 Out of all 380 cases reported during the years 2004 - 2018, the most belonged to the categories: Fire (66.8%), Overpressure Rupture (18.7%), and Service Call (6.3%).
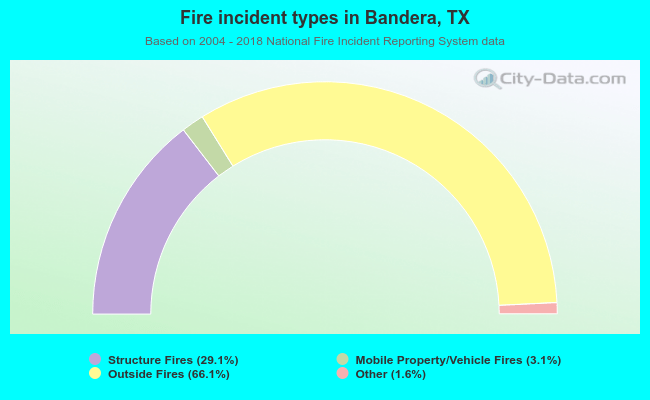 When looking into fire subcategories, the most reports belonged to: Outside Fires (66.1%), and Structure Fires (29.1%).