Bar Nunn: Fire Incidents, Wyoming (WY)
Where are fire incidents reported in Bar Nunn, WY
Something went wrong! Please refresh the page.
|
| |||||||||||||||||||||||||||||||||||||||||||||||||||||||||||||||||||||||||||||||||||||||||||||||||||||||||||||
2002 - 2018 National Fire Incident Reporting System (NFIRS) incidents
- Incident types reported to NFIRS in Bar Nunn, WY
- 37846.5%Rescue & EMS
- 20625.3%Good Intent Call
- 13316.4%Fire
- 506.2%Hazardous Condition
- 263.2%False Alarm
- 202.5%Service Call
- Fire incident types reported to NFIRS in Bar Nunn, WY
- 6045.1%Outside Fires
- 4030.1%Structure Fires
- 1813.5%Mobile Property/Vehicle Fires
- 1511.3%Other
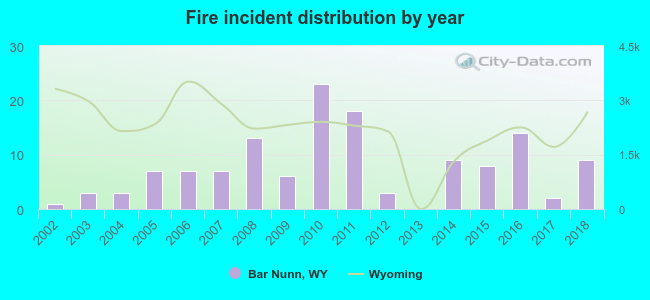 Based on the data from the years 2002 - 2018 the average number of fires per year is 8. The highest number of reported fire incidents - 23 took place in 2010, and the least - 0 in 2013. The data has a rising trend.
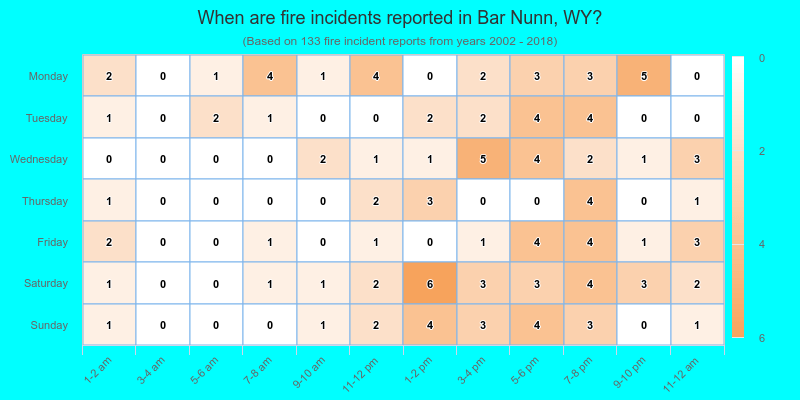
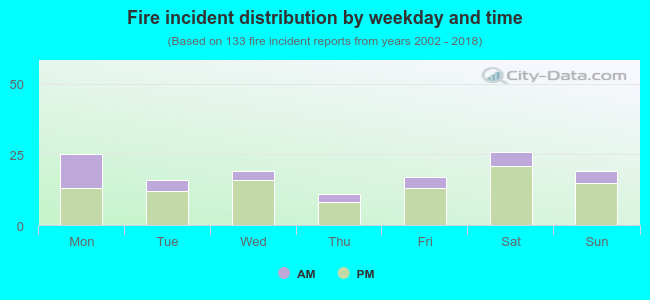 26.3% incidents where reported in the morning and 73.7% in the evening. The most fires (19.5%) took place on Saturday, and the least (8.3%) on Thursday.
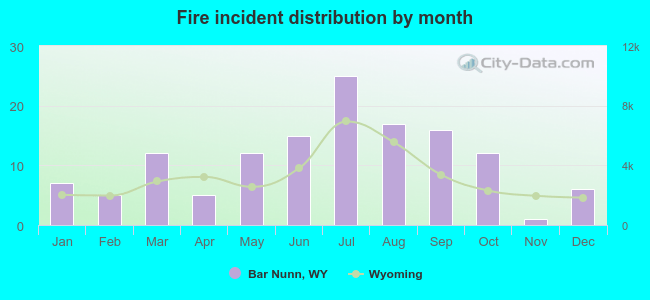 According to the 133 fire incident reports from years 2002 - 2018 most fires (18.8%) took place during July, and the least (0.8%) in November.
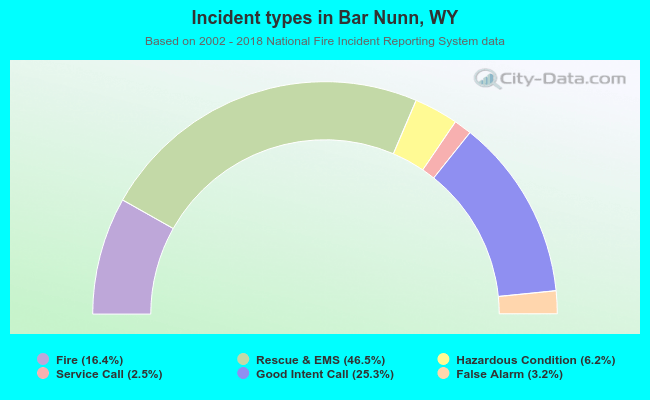 Out of all 813 cases reported during the years 2002 - 2018, the most belonged to the categories: Overpressure Rupture (46.5%), Service Call (25.3%), and Fire (16.4%).
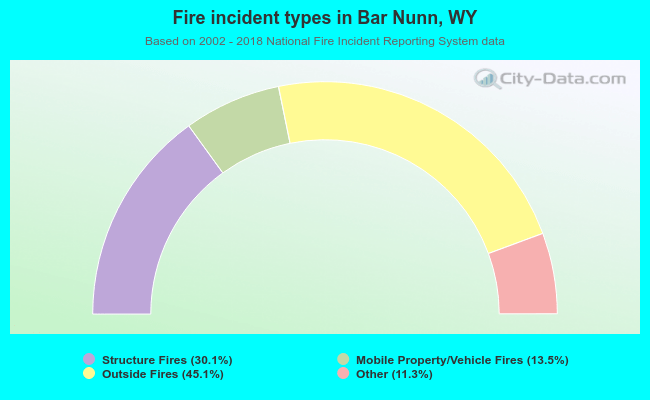 When looking into fire subcategories, the most incidents belonged to: Outside Fires (45.1%), and Structure Fires (30.1%).