| Fire incidents reported |
|---|
| Sreet name | Count |
|---|
| QUAKER RD | 52 | | LAKE RD | 30 | | CARMEN RD | 16 | | JOHNSON CREEK RD | 16 | | WEST SOMERSET RD | 16 | | HAIGHT RD | 12 | | HOSMER RD | 10 | | LAKE RD | 10 | | LAKE RD. | 10 | | RIDGE RD | 10 | | COLEMAN RD | 8 | | HARTLAND RD | 8 | | LOWER LAKE RD | 8 | | PALLISTER AVE | 8 | | 7725 LAKE RD | 6 | | JOHNSON CREEK RD. | 6 | | QUAKER RD | 6 | | QUAKER RD. | 6 | | TOWNLINE RD | 6 | | 2074 CARMEN ROAD | 4 | | CARMEN RD | 4 | | COUNTY LINE RD | 4 | | HAIGHT RD | 4 | | HALL | 4 | | HARTLAND RD | 4 |
| | | Fire incidents reported |
|---|
| Sreet name | Count |
|---|
| HOSMER RD | 4 | | LONNAN RD | 4 | | LOWER LAKE RD | 4 | | SOMERSET DR | 4 | | 1091 QUAKER ROAD | 2 | | 1127 QUAKER RD | 2 | | 1164 QUAKER RD. | 2 | | 1181 QUAKER ROAD | 2 | | 1190 QUAKER ROAD | 2 | | 1381 JOHNSTON CREEK | 2 | | 1381 JOHNSTON CREEK RD | 2 | | 1628 QUAKER RD | 2 | | 1650 CARMEN ROAD | 2 | | 1660 QUACKER RD | 2 | | 1678 QUACKER RD | 2 | | 1710 QUACKER RD | 2 | | 1831 JOHNSON CREEK ROAD | 2 | | 1849 CARMEN ROAD | 2 | | 1908 QUAKER ROAD | 2 | | 2010 QUAKER RD | 2 | | 2074 CARMEN RD | 2 | | 7125 EAST LAKE ROAD | 2 | | 7155 WEST SOMERSET RD | 2 | | 7329 WEST SOMERSET ROAD | 2 | | |
|
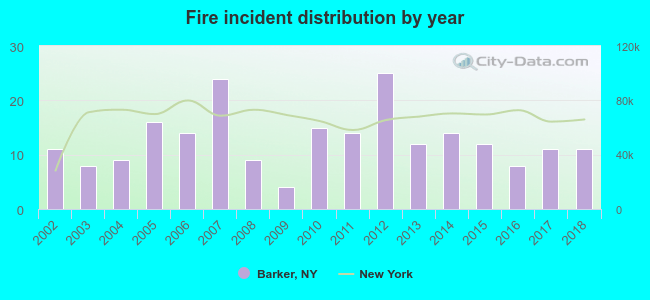 Based on the data from the years 2002 - 2018 the average number of fires per year is 13. The highest number of reported fires - 25 took place in 2012, and the least - 4 in 2009. The data has a constant trend.
 30.0% incidents where reported in the morning and 70.0% in the evening. The most fires (17.5%) took place on Saturday, and the least (9.2%) on Friday.
 According to the 217 fire incident reports from years 2002 - 2018 most fires (16.6%) took place during July, and the least (5.1%) in May.
 Out of all 608 cases reported during the years 2002 - 2018, the most belonged to the categories: Fire (35.7%), Hazardous Condition (20.4%), and Service Call (14.1%).
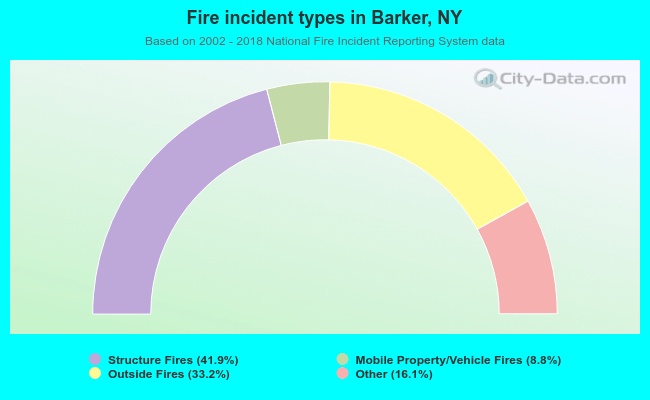 When looking into fire subcategories, the most reports belonged to: Structure Fires (41.9%), and Outside Fires (33.2%).