| Fire incidents reported |
|---|
| Sreet name | Count |
|---|
| EAST HARTLAND RD | 38 | | NEW HARTFORD RD | 36 | | GOOSE GREEN RD | 32 | | WARNER RD | 26 | | GAVITT RD | 24 | | RATLUM MOUNTAIN RD | 22 | | ROBIN DR | 22 | | EDDY RD | 18 | | PARK RD | 18 | | CENTER HILL RD | 16 | | OLD NORTH RD | 16 | | LEGEYT RD | 12 | | OLD NEW HARTFORD RD | 12 | | RATLUM RD | 12 | | WEST WEST HILL RD | 12 | | RESERVOIR RD | 10 | | DEER RUN RD | 8 | | EAST RIVER RD | 8 | | EAST WEST HILL RD | 8 | | NORTH CANTON RD | 8 | | OLD COUNTY RD | 8 | | SOUTH RD | 8 | | TAYLOR RD | 8 | | DAY RD | 6 | | DEER RUN | 6 |
| | | Fire incidents reported |
|---|
| Sreet name | Count |
|---|
| EAST HARTLAND RD | 6 | | GOOSE GREEN RD | 6 | | HARNESS DR | 6 | | LAVANDER RD | 6 | | OLD COACH RD | 6 | | OLD NEW HARTFORD RD | 6 | | PARK RD | 6 | | RIPLEY HILL RD | 6 | | RIVER RD | 6 | | RT 219 | 6 | | SWANSON RD | 6 | | YARMOSHUK RD | 6 | | BIRCHWOOD DR | 4 | | CENTER HILL RD. | 4 | | CHISWICK LANE | 4 | | DIANE DR | 4 | | FORGE HILL DR | 4 | | GREENWOODS RD | 4 | | HAMPSTED RD | 4 | | HARNESS RD | 4 | | HAYES RD | 4 | | NEW HARTFORD RD | 4 | | PARTRIDGE LANE | 4 | | PLEASANT VALLEY RD | 4 | | |
|
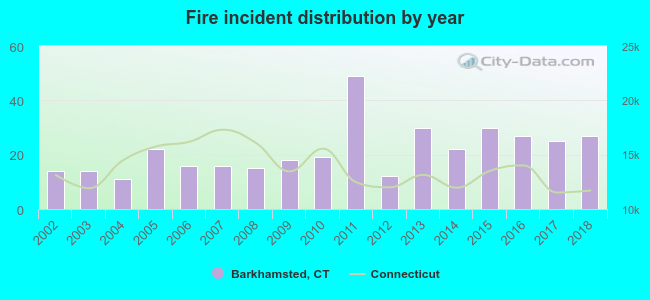 Based on the data from the years 2002 - 2018 the average number of fire incidents per year is 22. The highest number of reported fire incidents - 49 took place in 2011, and the least - 11 in 2004. The data has an increasing trend.
 32.4% incidents where reported in the morning and 67.6% in the evening. The most fires (16.3%) took place on Thursday, and the least (10.6%) on Tuesday.
 According to the 367 reports from years 2002 - 2018 most fires (13.6%) took place during February, and the least (2.7%) in June.
 Out of all 1,401 cases reported during the years 2002 - 2018, the most belonged to the categories: Hazardous Condition (29.6%), Fire (26.2%), and Rescue & EMS (18.9%).
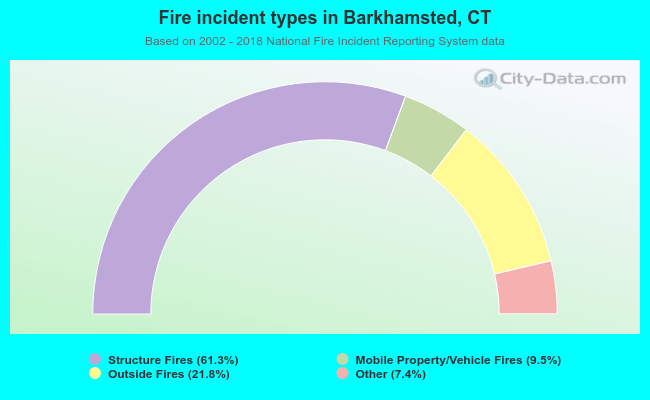 When looking into fire subcategories, the most incidents belonged to: Structure Fires (61.3%), and Outside Fires (21.8%).