Barnegat: Fire Incidents, New Jersey (NJ)
Where are fire incidents reported in Barnegat, NJ
Something went wrong! Please refresh the page.
| Fire incidents reported | |
|---|---|
| Sreet name | Count |
| BAY AVE | 154 |
| BARNEGAT BLVD | 64 |
| MAIN ST | 42 |
| VILLAGE DR | 42 |
| GARDEN STATE PKY | 28 |
| GEORGETOWN BLVD | 28 |
| WINDWARD DR | 26 |
| GUNNING RIVER RD | 24 |
| 72 RT | 22 |
| BRIGHTON RD | 22 |
| GARDEN STATE PARKWAY | 22 |
| DEER RUN DR | 16 |
| ROUTE 72 | 16 |
| DECK ST | 14 |
| LEXINGTON BLVD | 14 |
| BENGAL BLVD | 12 |
| BREAKERS DR | 12 |
| HIGHLAND DR | 12 |
| ROUTE 9 HWY | 12 |
| STARBOARD AVE | 12 |
| WEST BAY AVE | 12 |
| BAYSHORE DR | 10 |
| NAUTILUS DR | 10 |
| RAVENWOOD BLVD | 10 |
| ROUTE 9 | 10 |
| SCHOONER AVE | 10 |
| WEST BAY AVE | 10 |
| 539 RT | 8 |
| 900 BARNEGAT BLVD | 8 |
| BAYSIDE AVE | 8 |
| Other | 180 |
2003 - 2018 National Fire Incident Reporting System (NFIRS) incidents
- Incident types reported to NFIRS in Barnegat, NJ
- 96637.7%Hazardous Condition
- 87034.0%Fire
- 37314.6%False Alarm
- 1586.2%Good Intent Call
- 993.9%Rescue & EMS
- 843.3%Service Call
- 70.3%Special Incident
- 50.2%Severe Weather
- Fire incident types reported to NFIRS in Barnegat, NJ
- 37142.6%Structure Fires
- 31736.4%Outside Fires
- 12614.5%Mobile Property/Vehicle Fires
- 566.4%Other
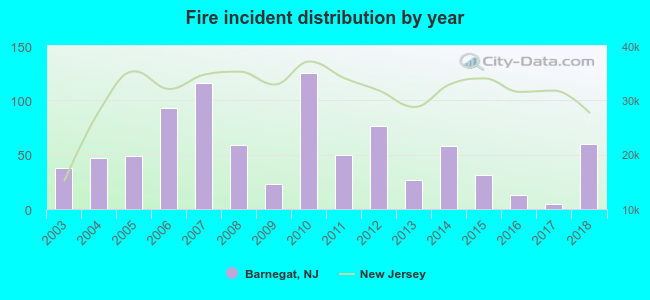 According to the data from the years 2003 - 2018 the average number of fires per year is 54. The highest number of reported fires - 125 took place in 2010, and the least - 5 in 2017. The data has a rising trend.
 The median response time based on all reported fire incidents is 5 minutes. This is about the same as the New Jersey median value.
The median response time in Barnegat, NJ compared to nearest cities:
(Note: Based on data for all years, including only cities with at least 500 fire incidents)
| Barnegat: | 5 minutes |
| Manahawkin: | 4 minutes |
| Forked River: | 5 minutes |
| Beachwood: | 4 minutes |
| Toms River: | 6 minutes |
| Lakewood: | 4 minutes |
| Browns Mills: | 7 minutes |
| Brigantine: | 3 minutes |
| Manasquan: | 5 minutes |
 32.0% incidents where reported in the morning and 68.0% in the evening. The most fires (19.0%) took place on Saturday, and the least (10.7%) on Thursday.
 Based on the 870 incident reports from years 2003 - 2018 most fires (14.7%) took place during April, and the least (5.7%) in October.
 Out of all 2,562 cases reported during the years 2003 - 2018, the most belonged to the categories: Rescue & EMS (37.7%), Fire (34.0%), and Good Intent Call (14.6%).
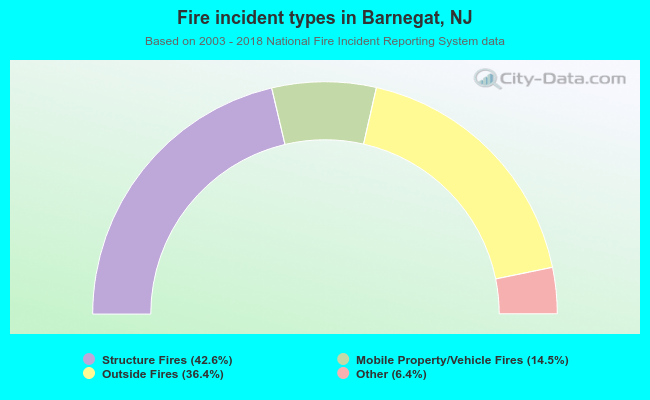 When looking into fire subcategories, the most reports belonged to: Structure Fires (42.6%), and Outside Fires (36.4%).