Barnesville: Fire Incidents, Ohio (OH)
Where are fire incidents reported in Barnesville, OH
Something went wrong! Please refresh the page.
|
| |||||||||||||||||||||||||||||||||||||||||||||||||||||||||||||||||||||||||||||||||||||||||||||||||||||||||||||
| Other | 75 | |||||||||||||||||||||||||||||||||||||||||||||||||||||||||||||||||||||||||||||||||||||||||||||||||||||||||||||
2002 - 2018 National Fire Incident Reporting System (NFIRS) incidents
- Incident types reported to NFIRS in Barnesville, OH
- 52946.9%Rescue & EMS
- 42737.9%Fire
- 766.7%Service Call
- 716.3%Good Intent Call
- 171.5%Hazardous Condition
- 50.4%False Alarm
- 20.2%Overpressure Rupture
- Fire incident types reported to NFIRS in Barnesville, OH
- 28667.0%Structure Fires
- 7016.4%Mobile Property/Vehicle Fires
- 6715.7%Outside Fires
- 40.9%Other
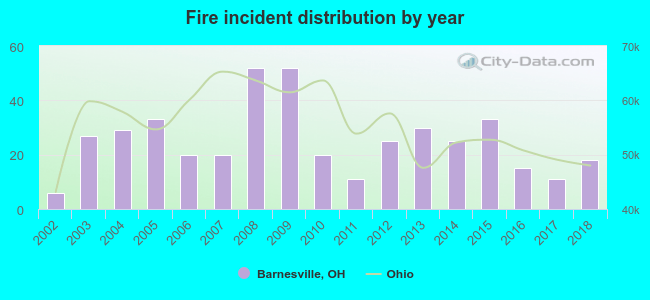 According to the data from the years 2002 - 2018 the average number of fires per year is 25. The highest number of fire incidents - 52 took place in 2008, and the least - 6 in 2002. The data has a growing trend.
 According to the data from the years 2002 - 2018 the average number of fire-related casualties per year is 0. The highest number of reported casualties - 4 took place in 2008, and the lowest - 0 in 2002. The data has a constant trend.
 37.7% incidents where reported in the morning and 62.3% in the evening. The most fires (16.9%) took place on Tuesday, and the least (8.7%) on Wednesday.
 According to the 427 incident reports from years 2002 - 2018 most fires (12.4%) took place during January, and the least (3.7%) in July.
 Out of all 1,127 cases reported during the years 2002 - 2018, the most belonged to the categories: Rescue & EMS (46.9%), Fire (37.9%), and Service Call (6.7%).
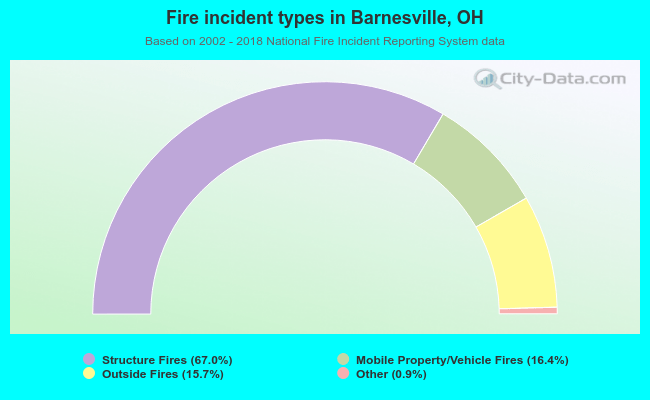 When looking into fire subcategories, the most incidents belonged to: Structure Fires (67.0%), and Mobile Property/Vehicle Fires (16.4%).